
Getting Started With Measuring Content Performance Using Google Analytics
During my apprenticeship in the Analytics & Insight team at Fresh Egg, I’ve come to appreciate the importance of measuring the performance of content, alongside previously defined goals, objectives and KPIs.
Tracking the performance of your content is of the utmost importance. If you don’t plan what the most important metrics are for your content or campaign, and for your audience, and track against these, how can you analyse how well the content has performed?
That’s where Google Analytics (GA) comes in. Having GA set up for your website/blog gives you access to a wide range of crucial data that gives you insight into your content performance. We’re going to give you some tips on how to use this data, and how to utilise the platform to make this performance analysis even more powerful.
It is important that measurement is always specifically relevant to the overall objectives, and for the best results this must be established before content creation or campaign work begins.
What is the objective of the content?
The metrics you need to track and the data which is most relevant to the content will be informed by the overall aim of the content. Before you start creating content, you should ask “what are we hoping to achieve with this content?” and “how does this relate to our overall business objectives?”
Are you looking to drive more brand awareness, increase overall sales, increase site authority, or generate new leads? The list goes on, and these objectives will be tailored to your business. There may even be more than one objective for a piece of content, and different strategies may be in play to achieve these objectives.
When planning your content, Fresh Egg recommends creating a measurement plan, which will help inform your wider strategy, and link your objectives together, across all channels. If you have no idea where to start with this, you can download our measurement plan template.
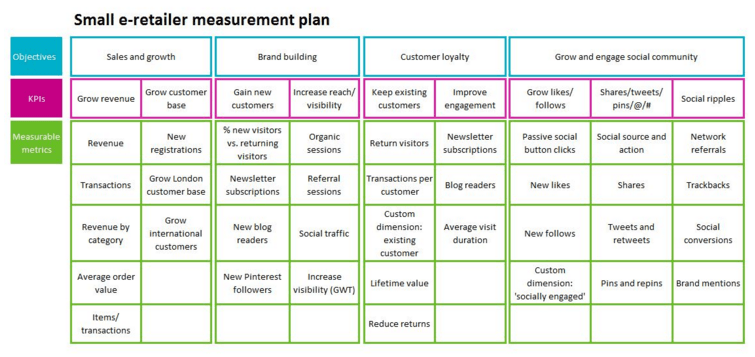
This measurement plan can be amended dependent on your needs. For example, in the marketing team uses a measurement plan that uses the above table but also takes into account overall objectives and secondary objectives, setting them against an achievement deadline. By using the measurement plan, it enables the team to tailor the content to help it hit specific goals and achieve the overall objective.
Top tip: This is a general, top level measurement plan which states the overall business objectives, and the metrics and KPIs to focus on. You could edit this measurement plan to include rows for the content you are creating at each of these stages.
Once you start building your measurement plan, you will be able to identify which metrics and KPIs make the most sense to track for the content you want to create, and knowing this can help you to be realistic, and benchmark what success will look like.
Top tip: Make sure that all key stakeholders have some input at this stage, as you can work together to really define the main objectives, and this also ensures everyone is working from the same page and expecting realistic results (think SMART):
- Specific
- Measurable
- Attainable
- Realistic
- Timely
Being realistic with the results you can expect to achieve is integral. It can help to look back at the performance of past campaigns/content for an idea of what to expect. Also think about context is important – what might have changed with your business/your industry to benchmark the expected results? Thinking about this means that you can get a more comprehensive idea of what is realistic for your content or campaign.
Below are three overall business objectives you might have, and tips on how to harness GA to support content performance tracking.
Aim: To increase brand awareness
If your business objective is to increase your brand awareness, then you may look at many different types of content; from blog posts, press releases, campaign work and maybe even competitions. But how do you track the performance of this content, and what are the best metrics to look at in line with your KPIs?
KPIs: Could include more impressions, more page views, better brand recall, and loyal customers.
Metrics:
- Page views – how many people have viewed the content/page?
- Returning visitors – how many visitors who have previously visited your website/content have returned
- Impressions – How many times has the page been presented to customers
Aim: To increase site authority
If your business objective is to increase site authority, then you may look at creating different types of content that answers questions your audience might be asking in the form of well-written online guides to information pages.
KPIs: Could include achieving more links or citations from authoritative sites to your content, more referral traffic, more users and more qualified users.
Metrics:
- % of new vs. returning users
- Average position (this is a metric to be mindful of as this doesn’t always indicate that your content is performing well, other factors could be at play, and make your content appear higher on search results pages)
- Number of links and citations
- Referral traffic from other websites which link to your content
Aim: To generate leads
If your business objective is lead generation, then you may look to a new campaign, online guides or information pages.
KPIs: Could include more phone calls, emails, registrations.
Metrics:
- Goal completions which occur on this page, such as ‘contact us’, form completions, sign-ups etc.
- Bounce rate – this can indicate whether content is helping to qualify users, and push them through their user journey to final purchase or lead generation stages.
Using GA to support the content performance tracking
As mentioned above, it’s possible to set up goals in GA for important customer interactions in regards to lead generation. These are a very effective way of helping you to identify how well your content has performed by converting browsers into customers.
You can set up a number of goals for a piece of content specifically (for example if there is a ‘sign-up’ or ‘contact us’ button on the page of the content itself the goal will track each time a user has completed this action).
You can even record whether a customer viewed a particular page on their journey to contacting you by setting up custom segments.
What about tracking smaller engagements, or micro conversions?
Average time on page is also a useful metric to keep an eye on, so you can get an idea of how much time your customers are spending on your pages and interacting with your content.
Micro conversions are worth taking notice of because they might contribute to more user interactions or conversions on your website. For example, if a user signs up to a newsletter, this then might qualify them to come back to the website at a later date and purchase a product.
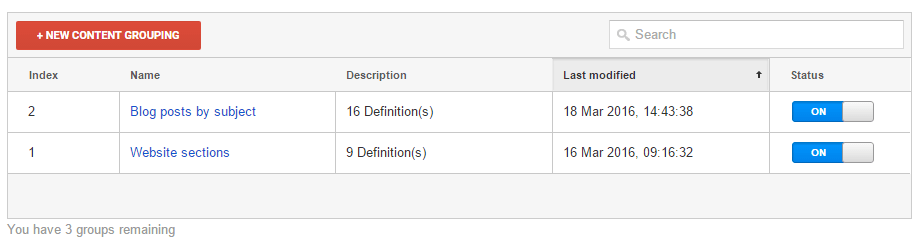
The power of content grouping
Content grouping is one of the most useful powerful yet underused features for analysing content performance in GA. It allows you to group content into structures which make sense to your business and objectives, allowing you to analyse the performance of related content (this is especially useful when you have a campaign containing many pieces of related content which work together to contribute to the overall goal).
By setting up content grouping based on what makes the most sense to your website/business, you can then analyse and compare the performance of different pieces of content on your site. Aggregated data is shown for each piece of content within the group. This is a great feature to utilise, as it allows you to make strategic decisions on how to improve future content, and look at why particular content or campaigns may have performed better/worse than others.
Here is an example of content grouping, in use on the Fresh Egg GA account:
If you would like more information on how to set up content grouping take a look at this post.
Track supporting metrics
It is important to track supporting metrics which sit outside of the overall objective, and can be used to record other positive impacts.
Looking at assisting metrics and conversions means you are getting the full picture when it comes to content performance, and allows you to properly analyse and draw statistical business decisions from your data. You will find that different types of content perform better than others, and in some cases the best performing metric might not be the one you were expecting, but will still bring important value to your content.
An example of this would be if you added product user guides to your site, with the main aim of selling more products. If you find that this content has not helped to sell as many products as you’d like, it may still have increased traffic and time onsite.
The content has then delivered additional value by being more engaging, attracting more target customers and exposing more people to your brand. As a result of this, these visitors may return to your brand when the time to purchase again comes about.
There are assisted conversions reports in GA which show the channel responsible for each conversion, and which channels assisted in these conversions. To view these reports, you must have goals set up.
Under the ‘conversions’ section, click ‘Multi-channel funnels’ and ‘Assisted conversions’ to view this useful information. These reports can be key in helping you to identify which channels perform best for which types of content. Utilising this information to tailor your strategy can yield better results.
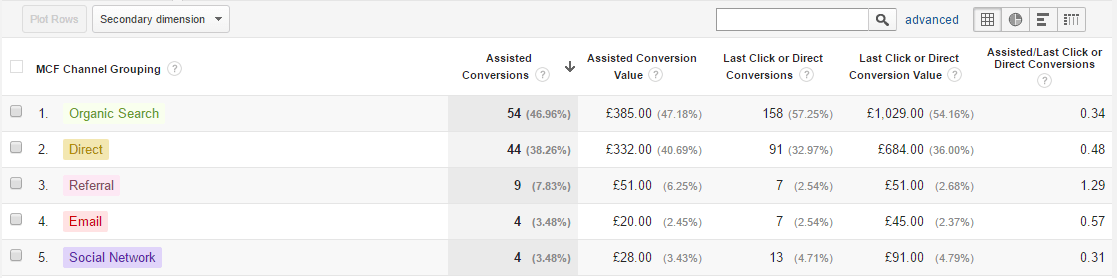
(Assisted conversions screen shot from the Fresh Egg Google Analytics account)
Using Google Search Console to track content performance
Google Search Console, a tool which enables webmaster to optimise website visibility, can also be a great platform to use for tracking content performance. If, for example, you are focused on improving your organic visibility with specific pieces of content, Google Search Console provides reports which outline the improvement in this visibility over a period of time.
You can associate a GA property with a site in your Search Console account, and this will provide you with this data in your GA reports, making it easier to access all of this data in one place, and draw more cohesive insights from it.
Top tip: Remember, you can only associate a website with Google Search Console, you cannot associate an app.
You can also check how the page is performing across the metrics in the Google Search Console reports, and these include:
- Clicks
- Impressions
- Average click-through rate
- Average position in organic search results
Setting up custom segments in GA
Custom segments in GA are extremely powerful. They allow you to isolate and analyse different subsets of data.
When analysing the performance of your content, you could use strategies such as creating segments for the URL of the page you want to measure. You could create a segment which shows people who have landed on/viewed a particular page during any point of their overall user journey. This can also help you see which pages might not drive direct conversions, but may assist other conversions and metrics.
For example, if you wanted to see how a user landing on and viewing a blog page affects their overall user journey, you could set up a custom segment which defines them as blog users, as shown below:
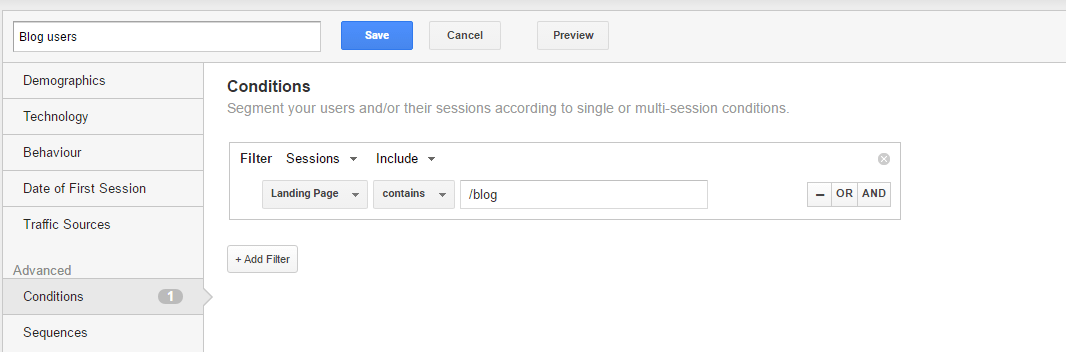
Under the ‘create a segment’ view, define your own conditions so that the landing page contains the page or section of the site you want to assess. Here we’ve used /blog, this will then pull out all of the sessions and users who viewed a blog page during any part of their journey. This segment can then be applied to any report enabling you to see how your users interact with the blog on their journey through your site.
Calculated metrics
GA enables you to create calculated metrics, which are user-defined metrics based upon those already recorded in GA. This feature is only available if you use Universal Analytics.
They use existing metrics which you already have in place in your account to push more relevant data and analysis. They can help you to drill down to different audiences and different objectives.
The point of calculated metrics is to give you control over how you measure success. They allow you to create your own metrics, and monitor what makes the most sense to your business alongside your objectives and goals. For example, if you are an online retailer, it could be imperative to keep track of the average order value of a transaction.
You can use calculated metrics to harness useful information for a variety of interactions on your website, whether that be conversions, sessions or engagement, calculated metrics are a very handy feature to familiarise yourself with, especially when measuring the performance of content.
Google evangelist Avinash Kaushik, recently posted about ‘smart calculated metrics’, offering a step-by-step guide on how to setup these metrics. Fresh Egg recommends using the following calculated metric for tracking content performance:
Applause rate: social activity by pageviews
Adding this as a calculated metric allows you to get a quick overview of which pieces of content performed best with your audience from a social point of view. Always be mindful that social media metrics are not the be all and end all, and as always, assisting conversions might be at play although not initially obvious.
Social interactions alone are not a great metric to measure the popularity or quality of content as this number is largely driven by how many people actually saw the content. Instead, by using a ratio of social interactions by number of pageviews (or even number of users who have seen the content), we get a much more accurate measure and can do some meaningful comparison, even between low traffic and high traffic content.
To add this as a calculated metric, use the formula: {{SocialInteractions}} / {{Pageviews}}. Once you have set this up, you will be able to report on ‘applause rate’ in custom reports and dashboards.
As an introduction to measuring content performance with GA, this post is by no means comprehensive. There is so much more you can do. If you are of a technical mindset and want to further explore how to get the most out of your content analysis, be sure to check out posts like this, from Google developer expert Simo Ahava.
Do you have any other top tips for tracking content performance? Let us know in the comments below. Or get in touch with our insight team if you need help measuring your success.