
GA4: When to use Explore reports, and when to use Looker Studio
Many marketers are caught between knowing the best medium to use when analysing valuable data. We explore the validity of using GA4's baked-in Explore reports or whether you should use Looker Studio to access and analyse data.
Like its UA predecessor, GA4 has a new reporting tool suite baked into the platform, including a customisable report library and saveable, accessible Explore reports.
At the same time, a quota limit has been introduced on the GA4 API into Looker. Therefore it is difficult (if not impossible) to build a dashboard without hitting the quota limit, which is a potential blocker for some people wanting to choose this method.
However, the new GA4 features provide fantastic opportunities for getting into the detail of your data.
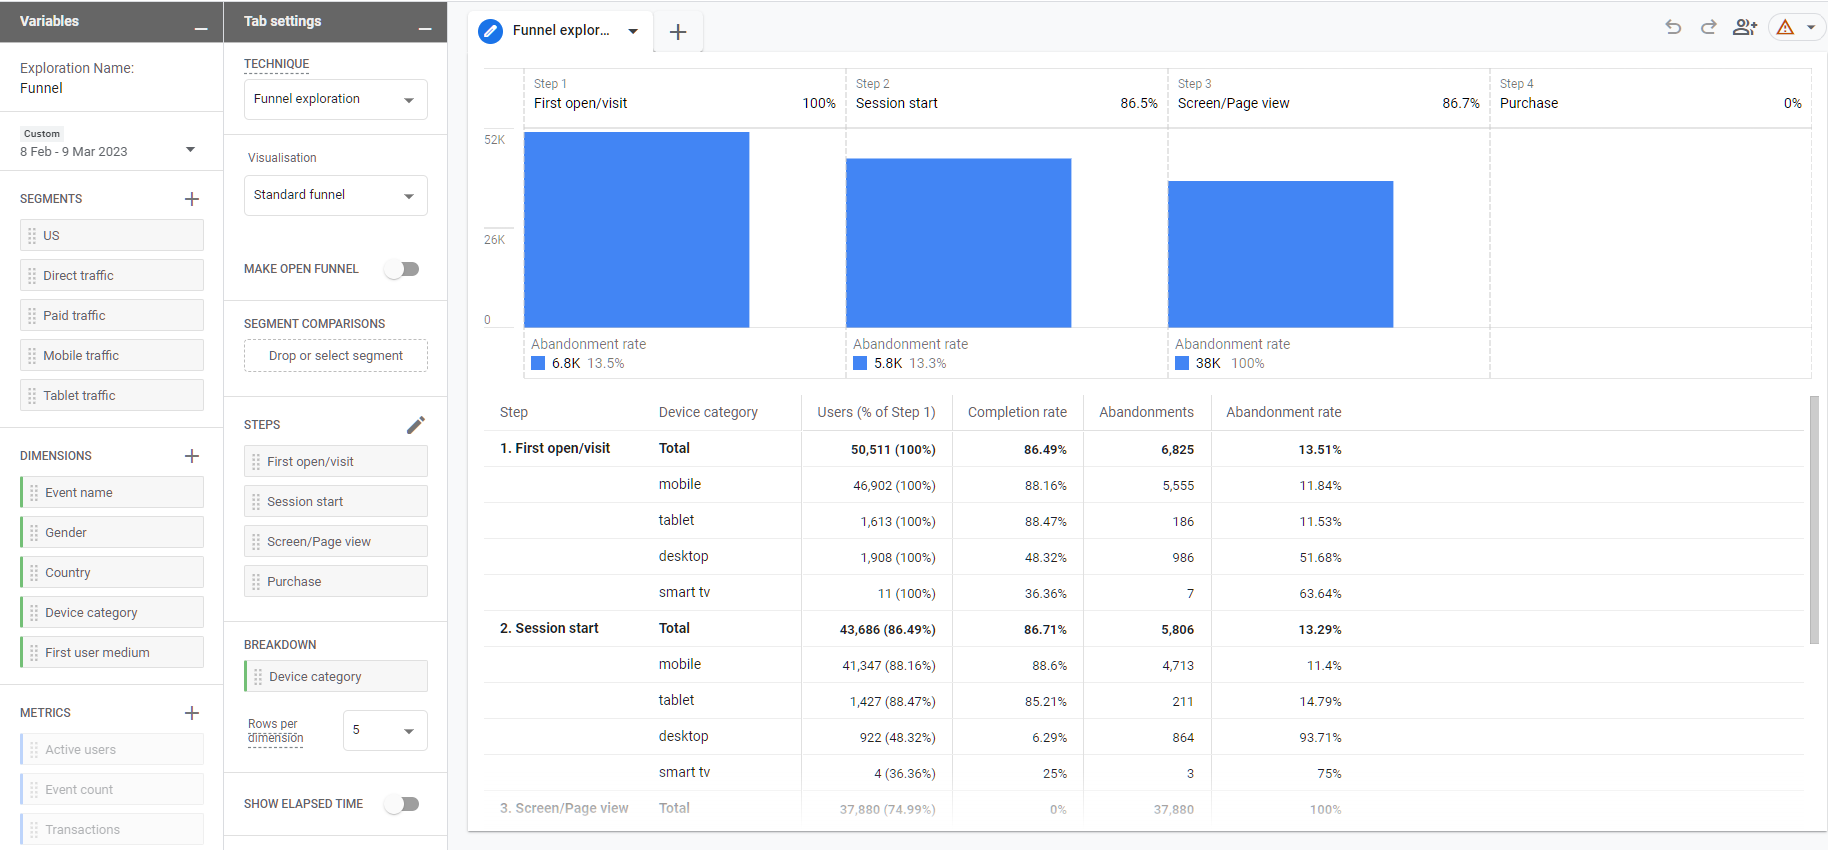
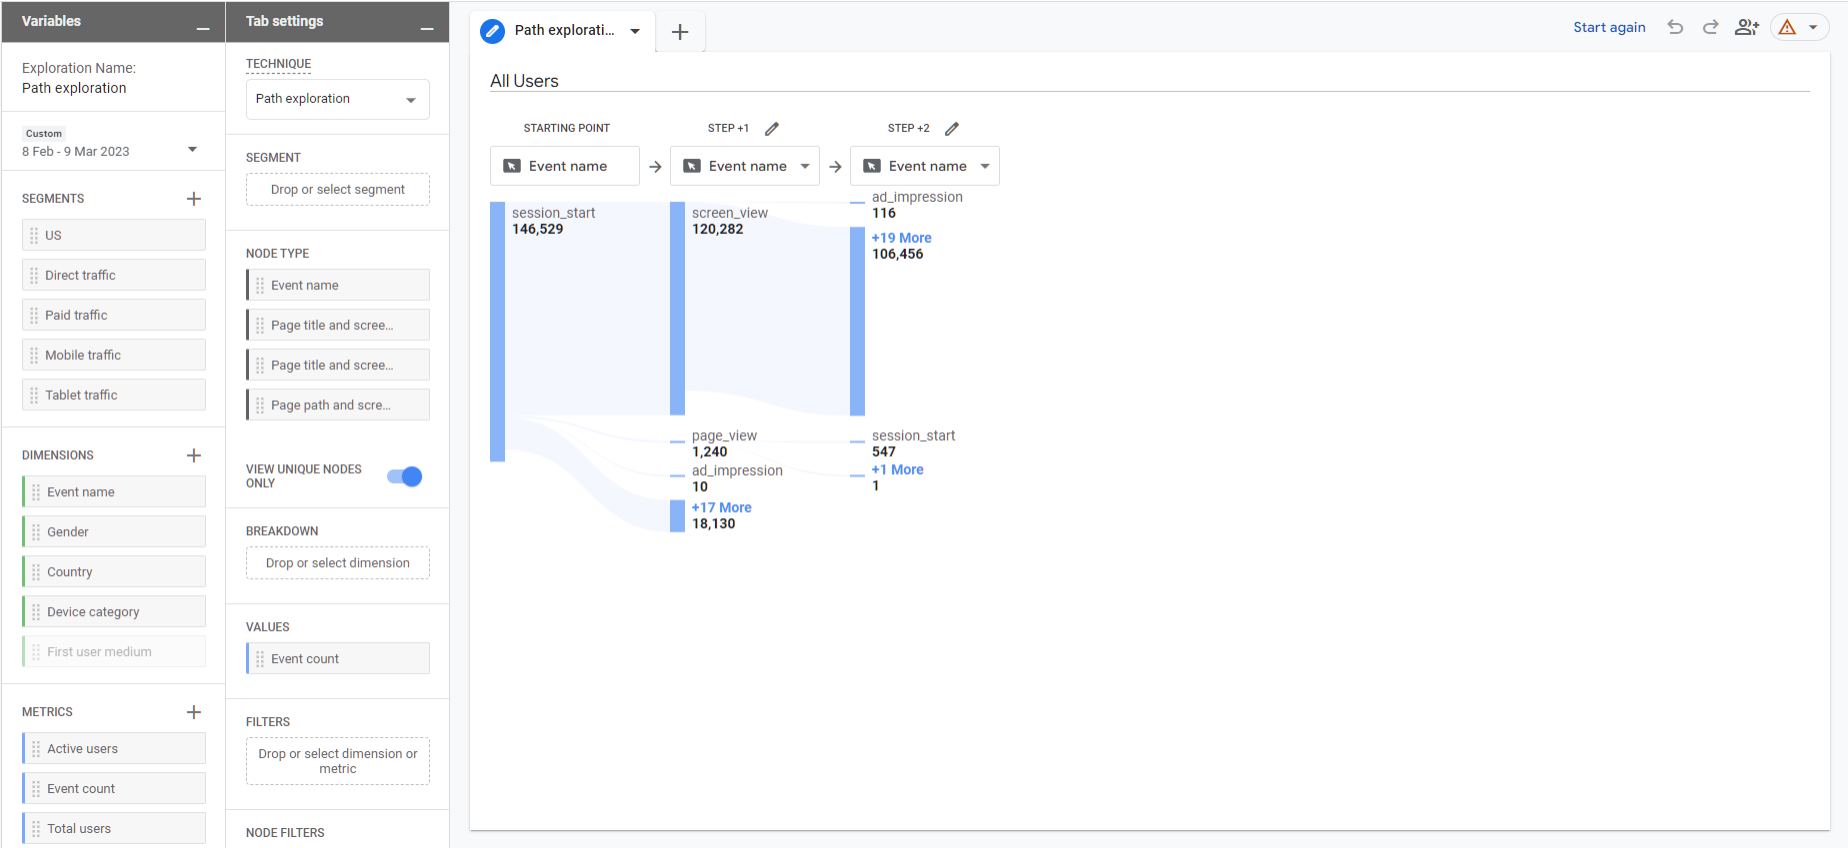
The GA4 Explore reports are a similar, improved version of the Universal Analytics custom report. Though not a perfect like-for-like, this feature enables you to save your configuration, check your numbers, and return to it in a few weeks.
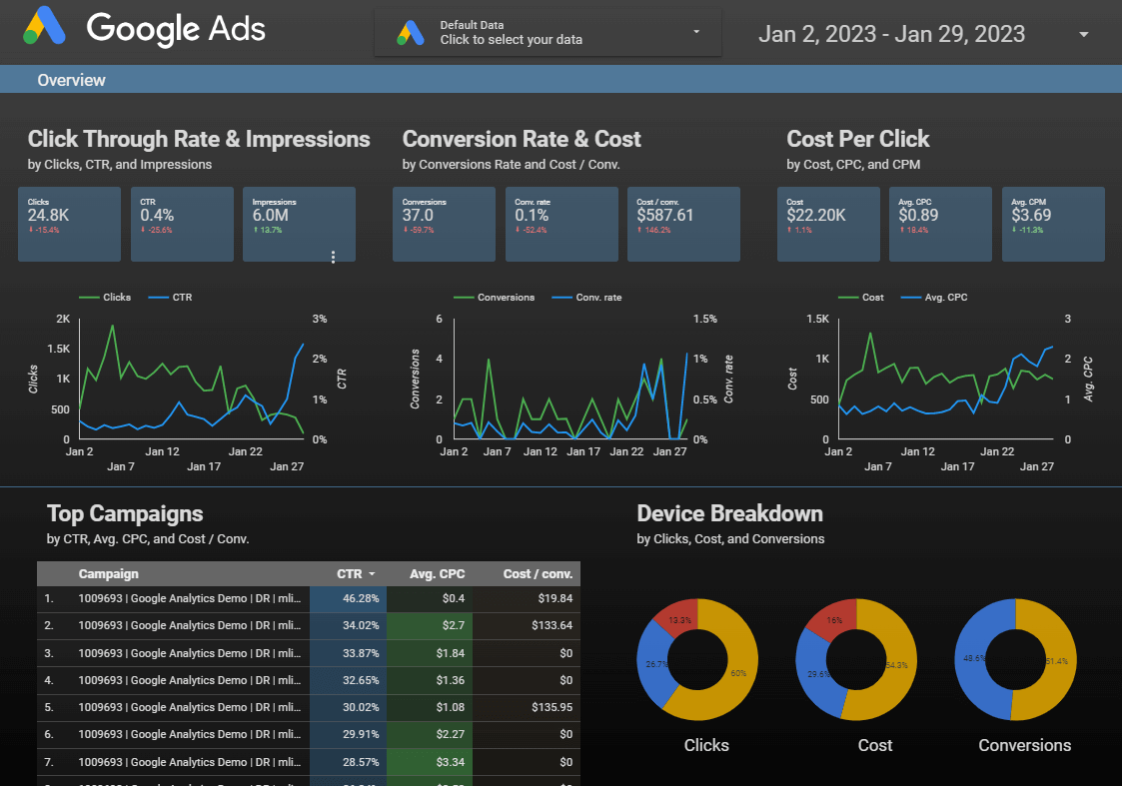
That said, we recommend using a combination of Looker Studio and BigQuery to build dashboards and reports, particularly when creating presentable data, monthly reports and evaluating campaigns.
What's important is you use a method that suits your needs. To help you, we've put together some of the pros and cons of either option.
Understanding the strengths of Google Analytics 4's Explore Reports and Looker Studio can help you make more informed decisions about which tool to use for your specific data analysis needs. Both have their strengths and weaknesses, and it's important to understand when to use each tool to maximize their benefits.
Lawrence Greenlee, Senior Web Analyst

Cons of using Explore Reports for monthly reporting
- Data retention – GA4 limits the amount of data users can access in Explore reports by up to two months and up to a maximum of 14 months. This limit means minimal year-on-year comparison is available for monitoring campaign success.
- Data accuracy – GA4 relies on sampling to return data quickly and thresholding to keep it anonymous. By using Explore reports, there is a chance thresholding, and sampling will impact your numbers.
- Sharing is difficult – Explore reports cannot be shared easily, as only one email account can edit them.
- Date ranges – The date function on an Explore report doesn't automatically update, meaning you'll need to update the date each month manually. It's a minor thing, but it is a disadvantage when getting your reports to your team on the first of each month.
- Limited visualisation – You're limited to GA4's visualisations. While there are many fantastic ones to play with, the available options will limit how you can visually represent data.
- No branding – There is no custom colour option on Explore reports. There are also no branding or logo options to give your reports a professional edge.
- Training and access – Anyone needing to access Explore reports will require GA4 access and (possibly) a little training.
In contrast, Looker Studio is an excellent solution for the problems above. There is no data retention limit; the tool allows for complete customisation and allows report sharing. Plus, if the standard visualisations in Looker Studio do not appeal, many community-made visualisations are available.
Pros of using BigQuery and Looker Studio
- No quota limitations – You can play with your data without hiccups. Once you create a dataset in BigQuery, you've done all the complicated work. Learn how to beat the GA4 data quota limit.
- Data ownership – You'll own your data as BigQuery stores it. Ownership is important as it means that you are not at the mercy of data retention policies being subject to change in the future. Read our guide and watch our helpful video: How to never lose your GA4 data.
- Combine with other data sources – Blend your Google Ads, Search Console, and Facebook Ads. You can add data from just about any platform. By storing this data in BigQuery, you can make lightning-fast reports in Looker Studio.
- Clean up data – Filter out bots and spam and eliminate test traffic from your data.
- Better data customisation - Retroactively apply custom channel and content groupings for enhanced analysis or segment audiences based on behaviour.
- Machine learning opportunities – Utilise and present predictive metrics to key stakeholders.
A note of caution: This API has a significant hurdle, though. Using BiqQuery has an associated cost (which puts some people off) - however, the many benefits of using the tool and Looker Studio together outweigh the cons.
Combining these two great tools is also simple: read our guide on setting up a GA4 BigQuery export.
When to use Explore reports
With all this said, you should still use Explore reports. They're an excellent resource for quick analysis, answering questions, or playing with the data for learning and discovering new opportunities. For example:
- Data checks and maintenance – Looking at your current, unfiltered data is an excellent way to check for (Personally Identifiable Information) PII or quickly ensure that your custom dimensions are working as intended.
- Quick looks – If you need an immediate answer, Explore reports offer simple tables to get vital information.
- One-off and deep-dive analysis – If you need to go down a rabbit hole, Explore reports are often the correct solution. Quicker to start, Explore aids analysts by assisting in the one-off analysis to support strategic thinking.
- Data parity checks – If you need to check the difference between what your Looker Studio is saying versus GA4, you will benefit from setting up a handful of Explore reports to spot-check each month.
Questions you should ask before deciding which tool to use:
- Who is the report for?
- If it is for yourself, consider an Explore report.
- If it is for someone else on your team, a stakeholder, or a dashboard you'll need (again and again), we recommend going with Looker Studio.
Do you need help creating brilliant reports to analyse data? We can help. Chat with us on how we can help your organisation with its data challenges.
Contact us or call us on 01903 285900.