
7 Free SEO Tools You Should Be Using
By Intern |28 Jun 2016
(This blog post was written by Roxanne Dwyer in our Sydney office)
We all know that there is no shortage when it comes to SEO tools. With so many options available on the web, where do we start looking for quality tools that are worth the effort?
The benefits of using SEO tools
First of all, a reminder why we should use SEO tools and plugins:
- They are easy to use
- Many are free!
- Browser extensions can be easily installed onto your PC and used on the go
- A good SEO plugin can save you time
Essential SEO tools and plugins
Forget the obvious larger tools for the moment, such as the likes of Google Analytics, Google Search Console, Screaming Frog and Keyword Planner. Here at Fresh Egg, we’ve shortlisted a few handy tools, most of which are available within the Chrome web store, as free extensions.
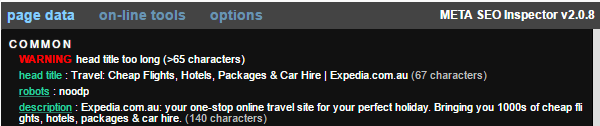
1. META SEO inspector
The META SEO inspector is a great tool for anyone wanting to evaluate meta data and html tags on any given page, without opening the source code. Information such as the number of characters used within any given page title and meta description are displayed on a panel, which pops up when clicking on the browser extension icon.
What else? Warnings are provided and marked in red, to indicate where a description tag is exceeding the character length or if the tag is missing altogether.
This all-in-one extension will also detect and display pagination attributes, such as the canonical URL, as well as checking if rel=next or rel=prev tags exist. This is particularly valuable when evaluating category pages including, but not limited to, blog pages.
It’s also worth noting that you can click on the ‘options’ heading within the panel, where you are presented with a check-box to outline nofollow links on a page.
2. Redirect path
Ayima.com have a useful extension to help detect any issues regarding the status code of a page. As the name suggests, the tool outlines the redirect path of the page, quickly flagging 301, 302, 403, 404 and 500 HTTP status codes. This also extends to JavaScript and meta redirects.
Apart from the redirect path, you can also view other information within the request HTTP headers, such as server details, cookie data and cache-control. This can be helpful in addressing performance issues, such as load times.
Overall this is an invaluable extension for site audits as it enables you to detect errors instantly. More importantly, you can determine if a website may be missing out on valuable link equity, due to redirect chains.
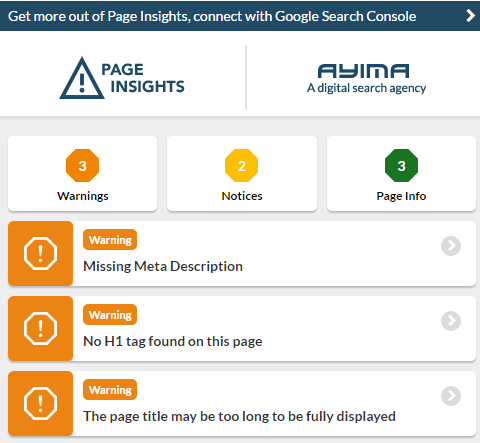
3. Page insights
When we were reviewing Ayima’s Redirect Path we discovered their latest Chrome extension, Ayima Page Insights. Recently released in March 2016, there hasn’t yet been a chance to fully test this new tool but from what can be seen, it provides a handy overview of common on-page issues. This includes highlighting topline errors, warnings, notices and displaying page information, such as meta data.
There’s also the ability to link the extension to your Google Search Console account – enabling you to view traffic data for any given page, such as impressions, click through rates and average position. Simply click on the banner within the tool to connect – this will prompt you to give permissions to the app.
4. Scraper
So you want to review the URLs in Google Index? Let’s take a ‘site:’ search for Fresheggdigital.com.au. With hundreds of URLs appearing in the SERPs, having to go through each URL one by one wouldn’t be the greatest use of anyone’s time. Thankfully, there’s a savvy solution.
Introducing the Scraper Plugin for Chrome. Simply change your search settings within Google from 10 to 100 results per page. (You will receive a notification that your preferences have been saved). Then you will need to follow these steps:
1. Download the free extension from the Chrome Web store
2. Run your search within Google (E.g. site:fresheggdigital.com.au)
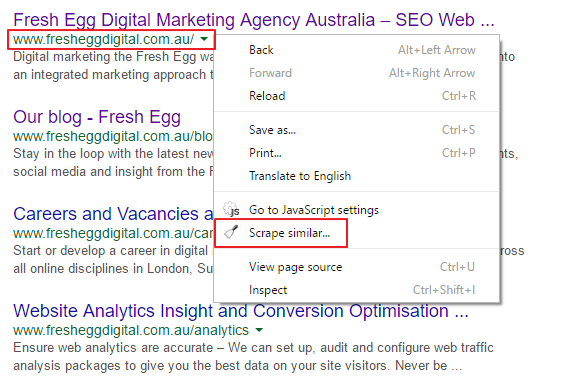
3. Right click next to the piece of information you require. In this case we are examining the URLs
4. Click on the ‘Scrape similar…’ option, as highlighted in the below image
5. The Scraper application will open and here you will be able to copy this information to the clipboard or export straight into Google docs
6. Repeat this for Page 2 results, and so on
5. Fiddler
Understand what’s going on between your browsers and servers. Fiddler is known as the ultimate web debugging tool, and has many useful features, such as:
- Debugging traffic from any browser, system or platform
- The ability to switch location – with a wide selection of 130 locations
- When compared to other tools in the market it is more efficient, with a far less chance of your browser constantly freezing
Fiddler allows you to understand what’s going on behind the scenes, by logging traffic and the requests made by your browser to a server, and the subsequent responses. From here you can use it to examine traffic and, where necessary, troubleshoot incoming HTTP requests.
6. BuiltWith
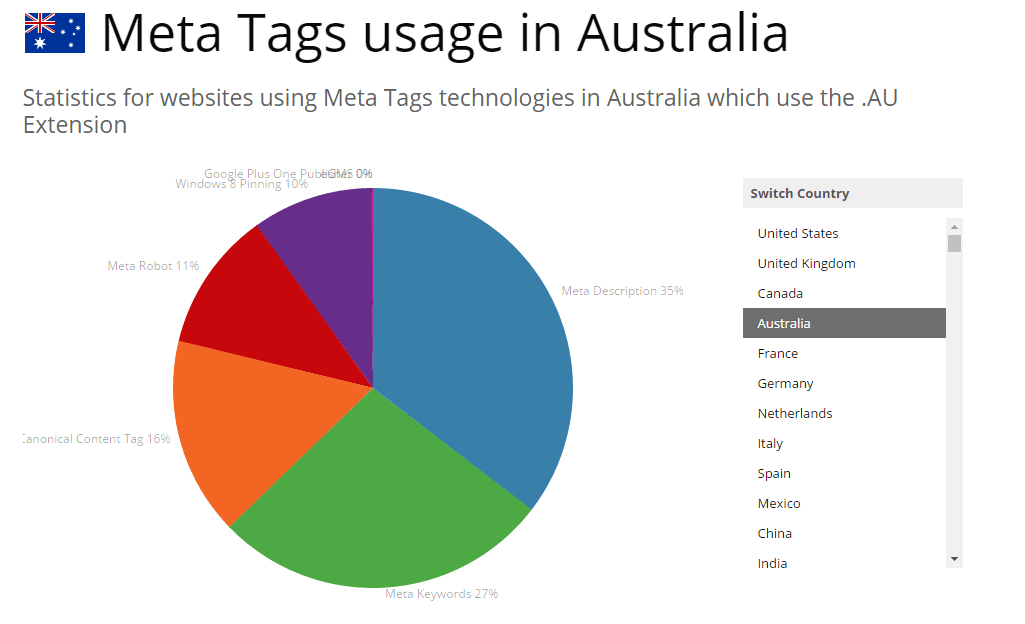
What Content Management System (CMS) is your website using? Has Google Analytics tracking been setup correctly? By downloading the free browser extension, BuiltWith Technology Profiler you can view the various technologies used on a website, with one simple click.
You can also learn about all the web technologies, and their overall trends and usage statistics.
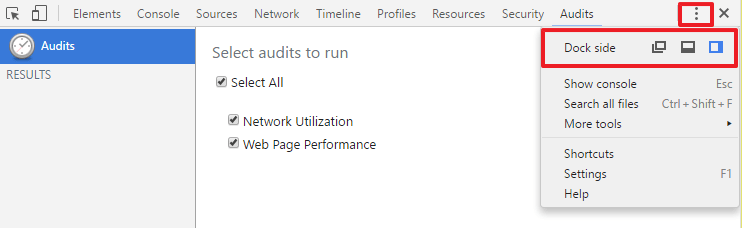
7. Developer Console Tools
Whether your preferred browser is Chrome or Firefox, you can inspect the elements on any given page via the Developer Tools. The easier way to open the console is to right click on a landing page and select ‘Inspect’, or for Firefox users, ‘Inspect Element’. You might even prefer the Windows shortcut, Ctrl + Shift + I.
From a usability point of view the console provides three alternate views:
- The bottom of the browser
- The right hand side of the browser
- Separate window
There’s a lot to cover within the tool so here a few tips to get you started!
The ‘Audits’ tab is an easy to use feature. Here you can review your webpage speed performance to understand how you can improve the load times on your site.
You can also use the ‘Timeline’ feature to interpret your site speed further, by understanding the time taken to load resources, render JavaScript files, parse HTML and so on. The timeline data can also be saved, and shared!
Also let’s not forget the useful device mode feature, allowing your website content to be tested across various devices and screen resolutions.
Do you have a favourite SEO browser extension or tool? Feel free to share your opinions in the comments section.
Interested in an SEO Site Audit or FREE Spot-Check? Click here for more details!