Customising an individual report
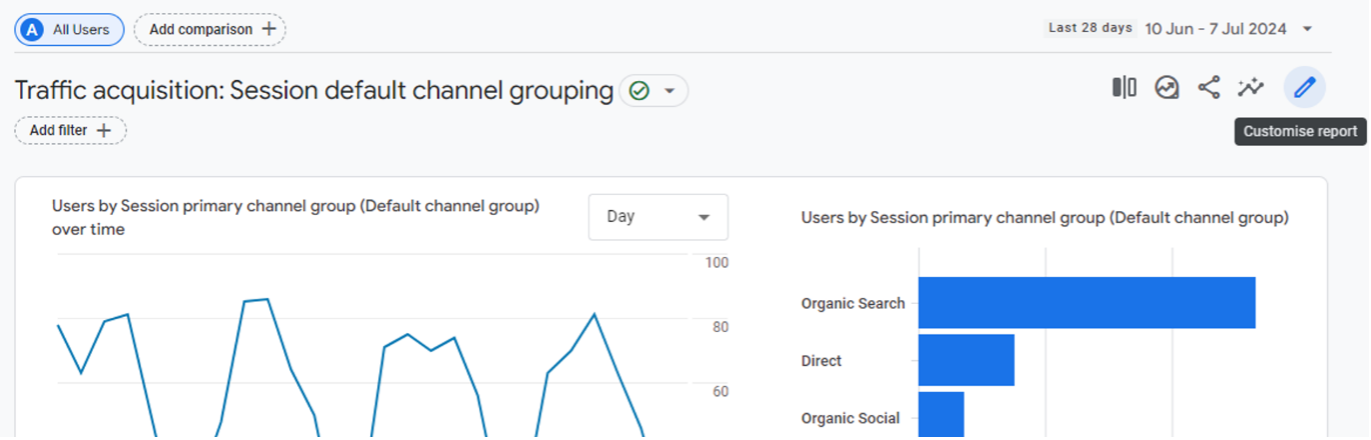
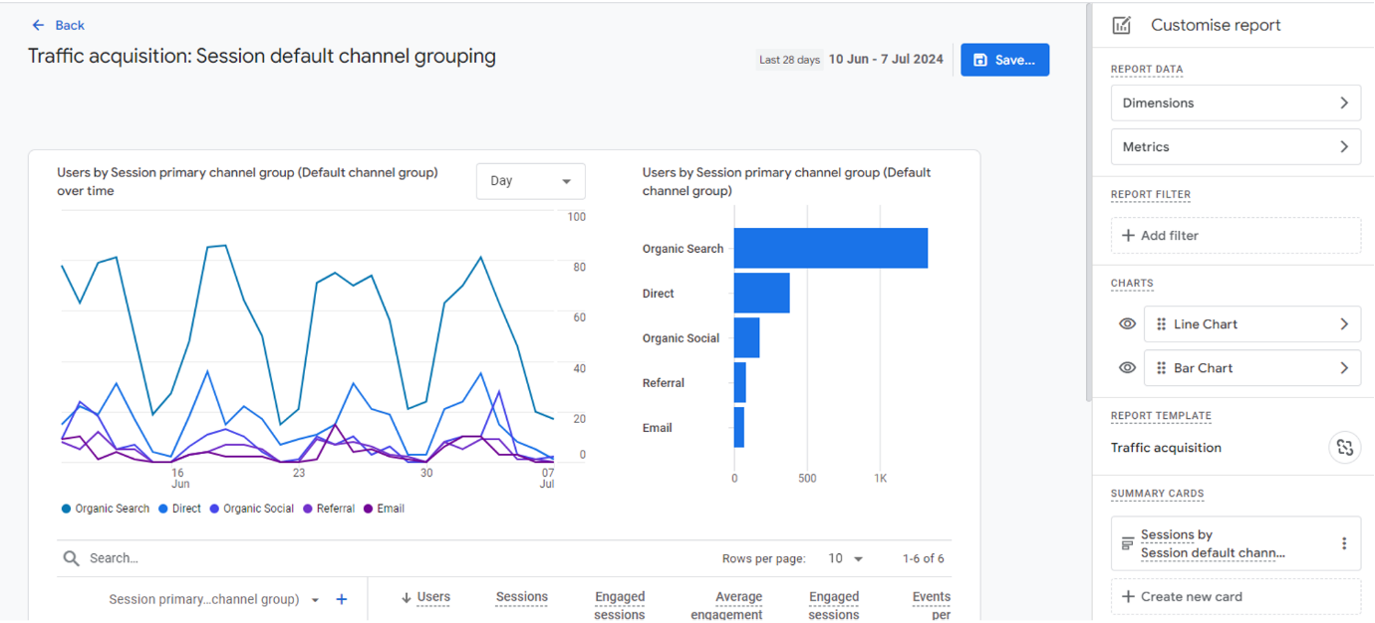
To customise one of the reports you already have in GA4, go to that report and hit the 'Customise report' button (you will need at least editor access to do this). This will open a panel that lets you edit what you see in the report. Below, I explain each of the different options for customising these reports.
Customising dimensions
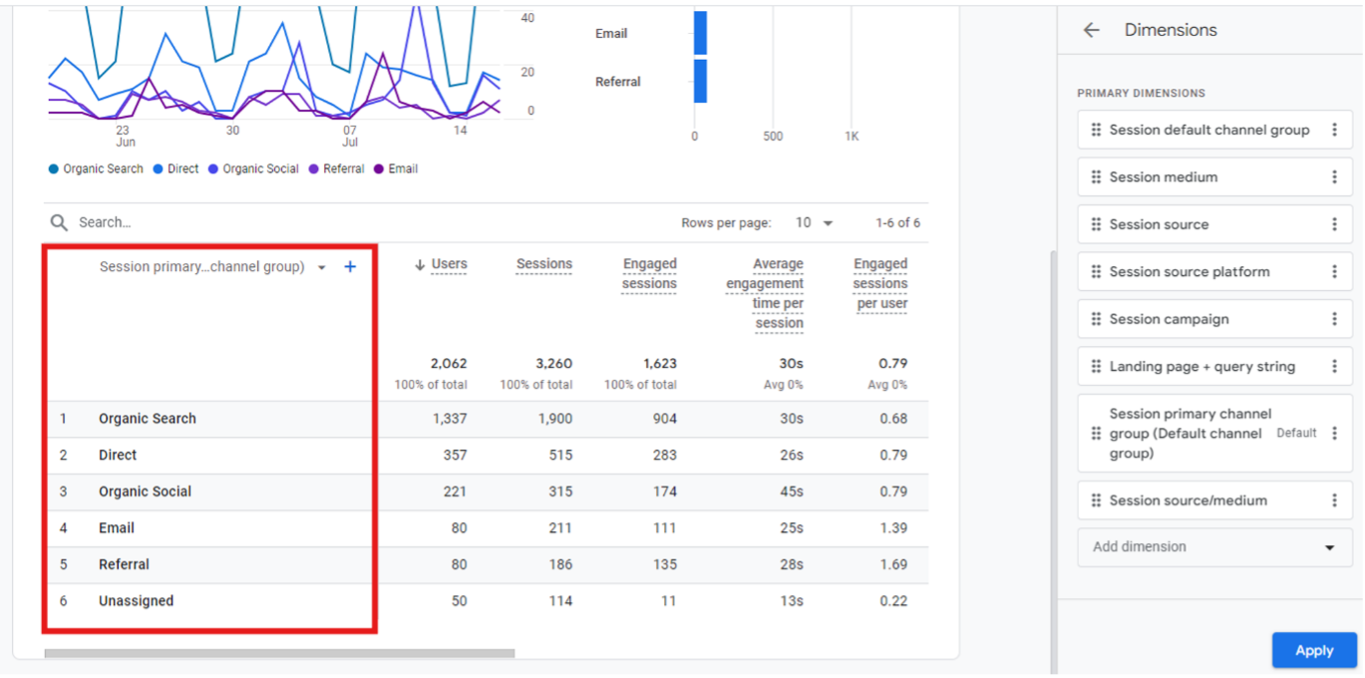
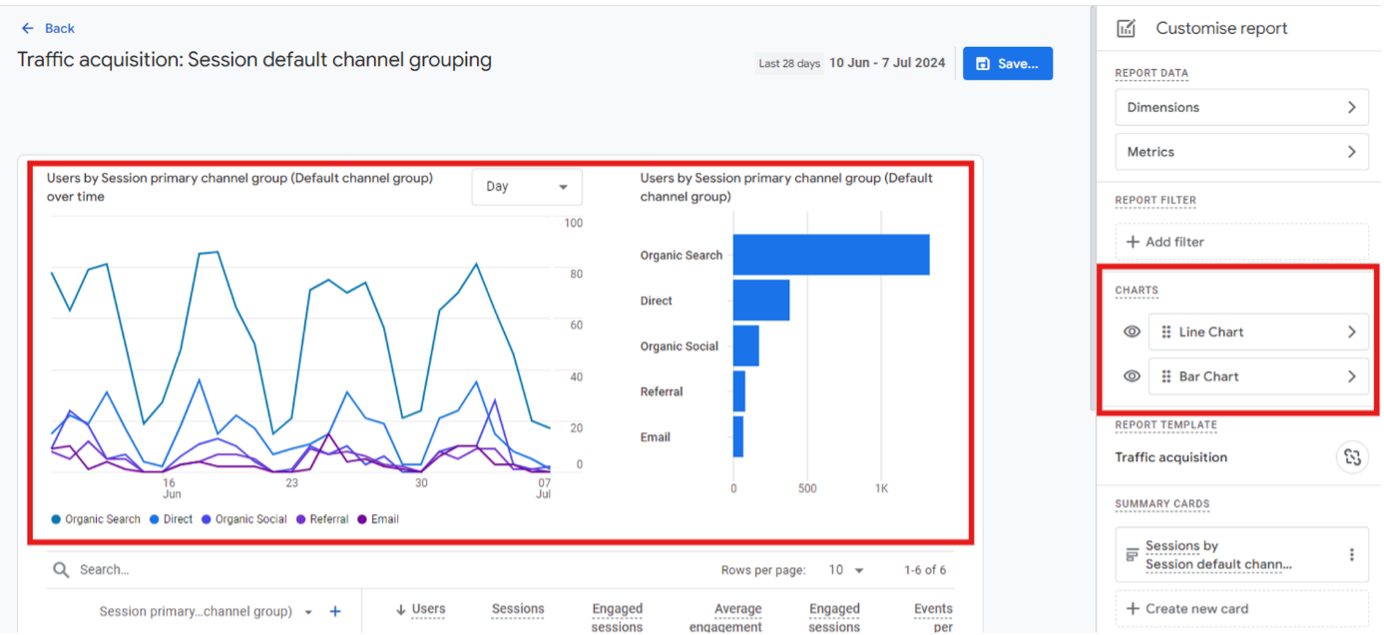
Under 'REPORT DATA', if you click dimensions, you can select the options for the primary dimension and set the default dimension by clicking the three dots beside the dimension of your choice.
Customising metrics
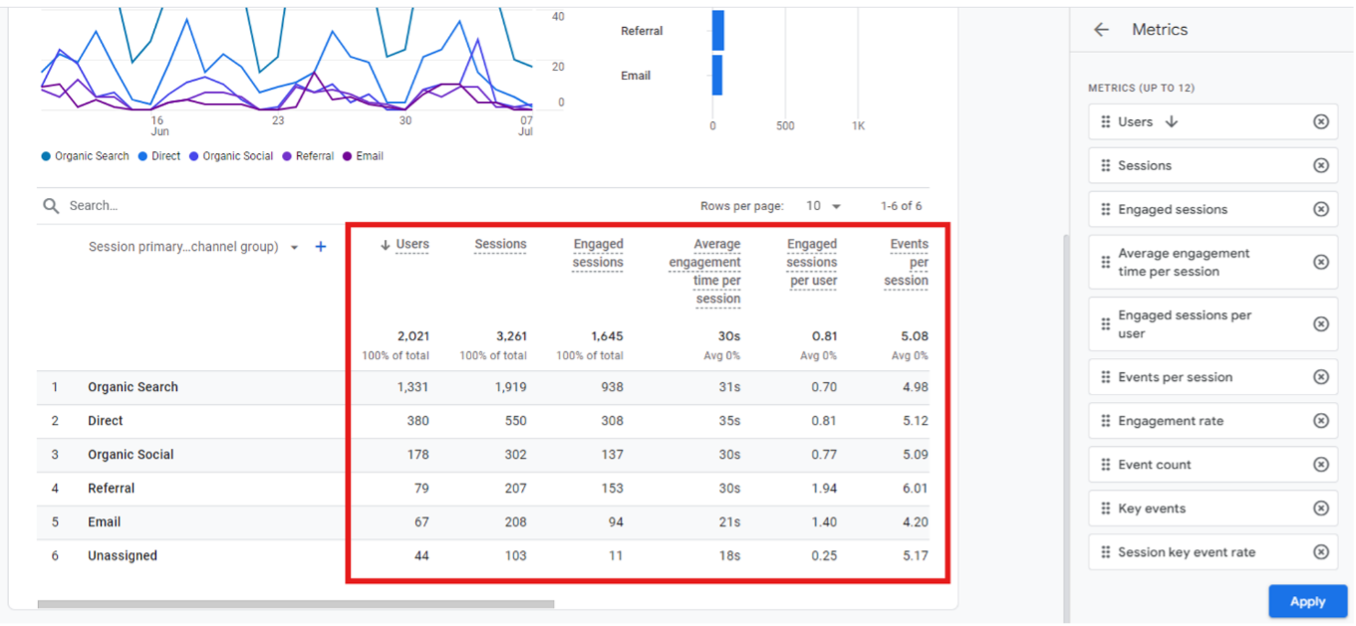
By clicking 'Metrics,' you can add, remove, and change the order of the metrics in the table.
To change which metric the table will sort by default, you simply click on that metric, and an arrow will appear beside it to indicate that. Whichever metric the table is sorted by is also the one that will appear in the charts above.
Applying filters
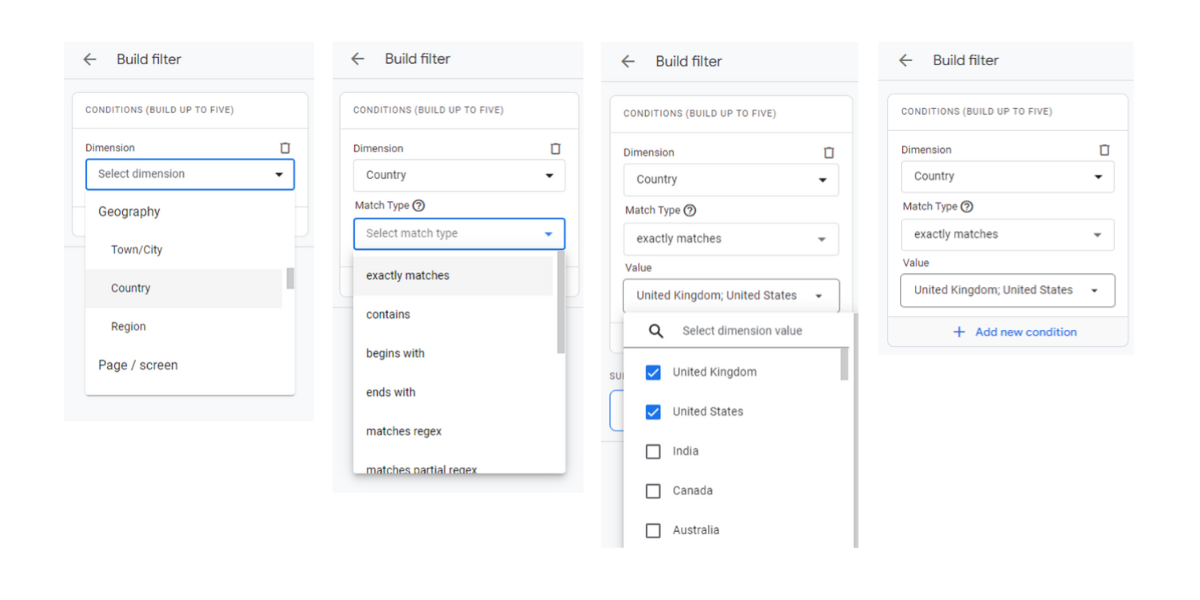
If you want your report to focus on a subset of your data, you can apply a filter to your report under the 'REPORT FILTER' section. You can only apply one filter, but it can have up to five conditions. Select your dimension, match type and value(s), then hit 'Add new condition' to add any other conditions you want and 'Apply' when ready.
Customising charts
The 'CHARTS' section lets you control what charts you see at the top of your report. You can pick from three chart types: line, bar and scatter.
To see just one chart or none at all, click the eye symbol to toggle the visibility of the charts.
Report templates
If the report you're editing is one of the standard Google ones, you will see the name of your report under the 'REPORT TEMPLATE' heading; if not, it will say 'No template'. If your report is linked to a template, it will automatically be updated when Google changes it. These updates will not override your changes, so there is no reason to unlink it, especially as once a report is unlinked, it cannot be linked again.
Customising the overview reports
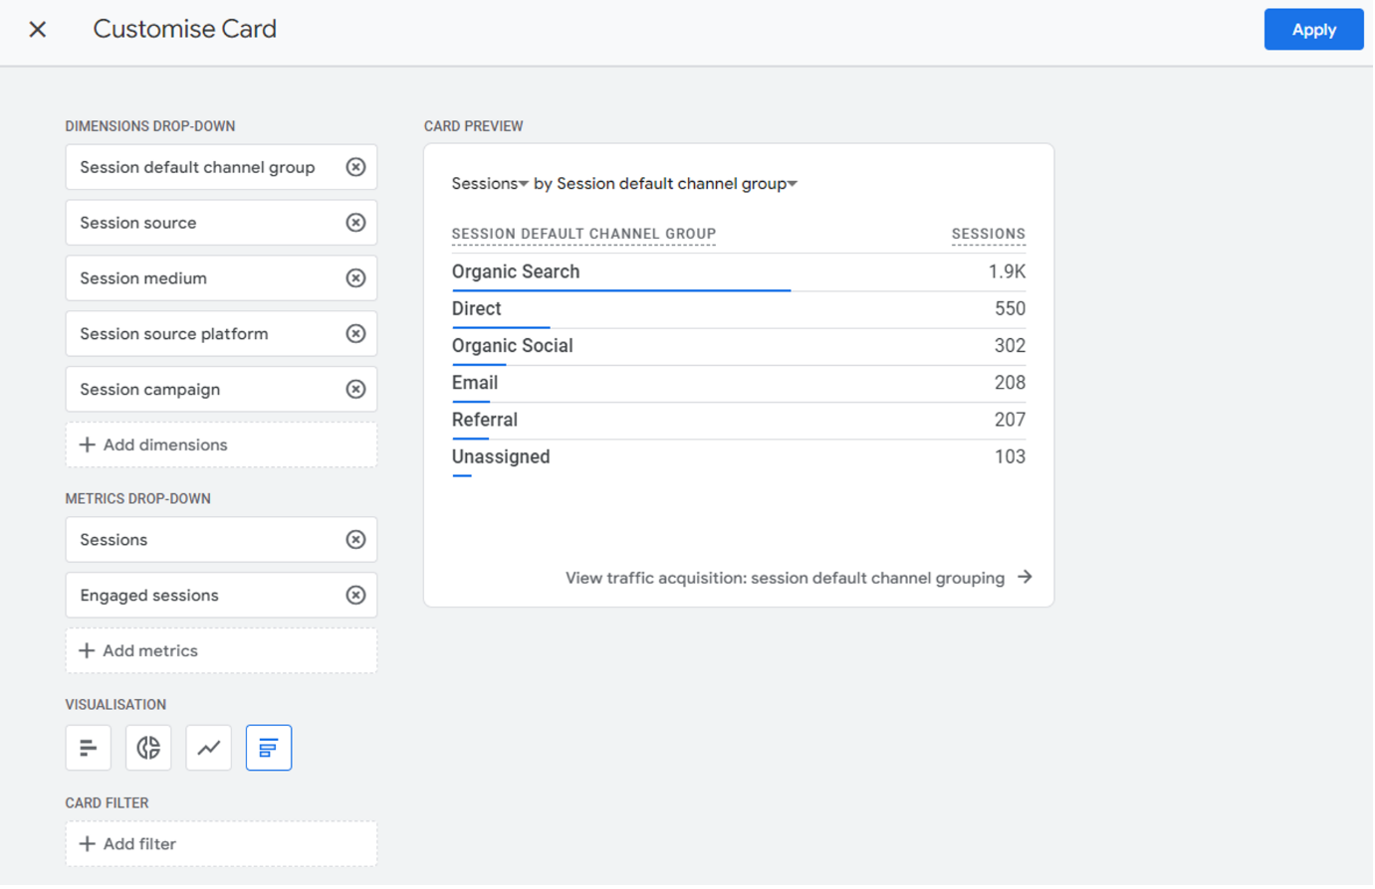
Under the 'SUMMARY CARDS' section, you can edit and add cards, which you will see in the report's overview section.
Clicking the three dots, then 'Edit' or 'Create new card', will open a panel that lets you modify or create your card.
You can choose which dimensions and metrics you want to see in the card, with the first in the list being what is shown by default and the rest being selectable via drop-down.
You can choose between four visualisation types for your card: bar chart, pie chart, line chart and table.
You can also add filters to your card, the same way you add them to your report.
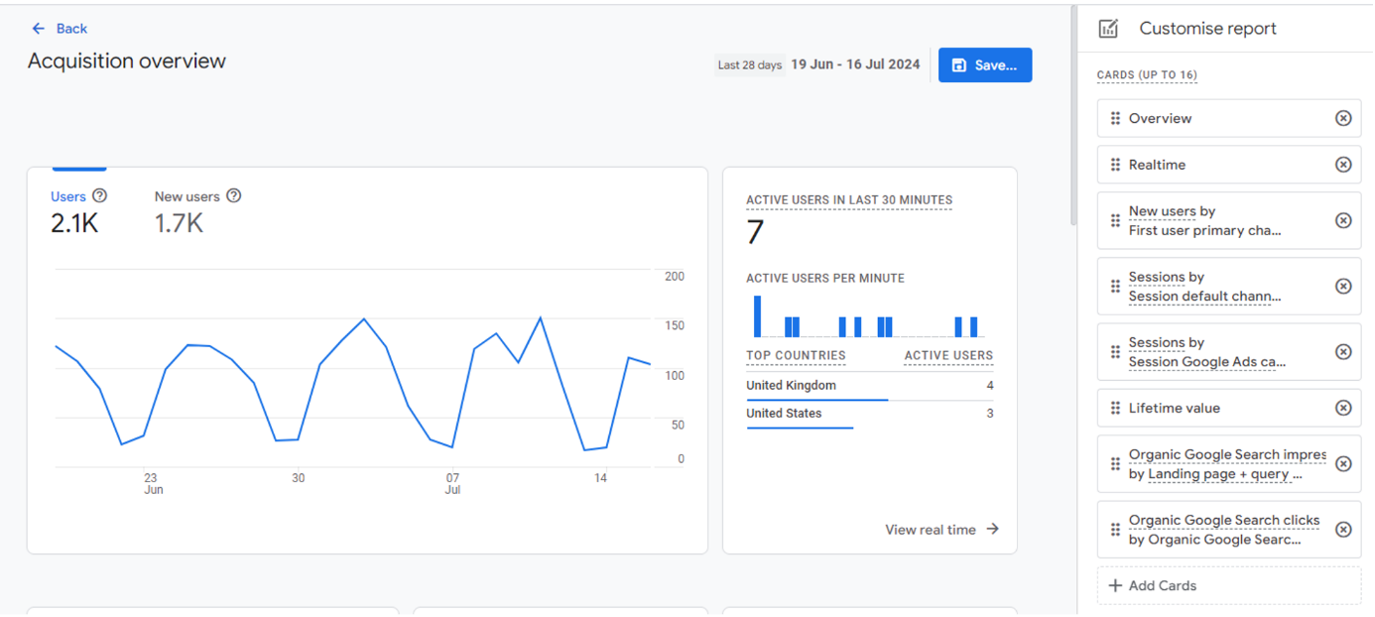
You can edit the overview reports via the same 'Customise report' button in the top right. Here, you can add, remove and control the order of all the cards that appear on this page, but to edit them, you'll have to go to the card's respective detail report.
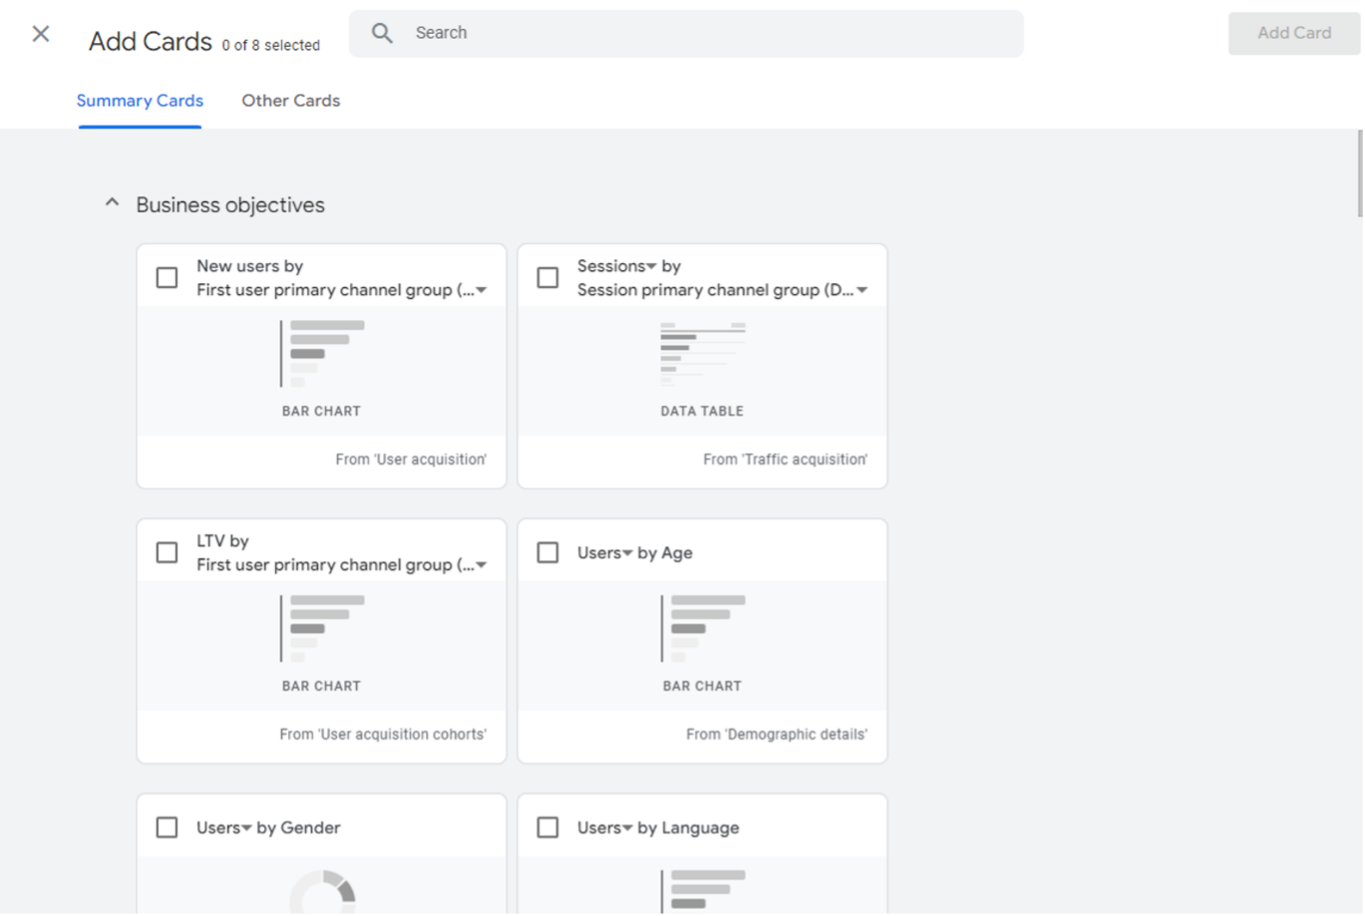
When you click 'Add cards' here, the platform will display several templates for cards you can add.
Again, to edit them, you'll need to go to their respective reports. At the bottom, it will tell you which report the card is from.
Then, when you are happy with all your changes, click 'Save'.