Overview
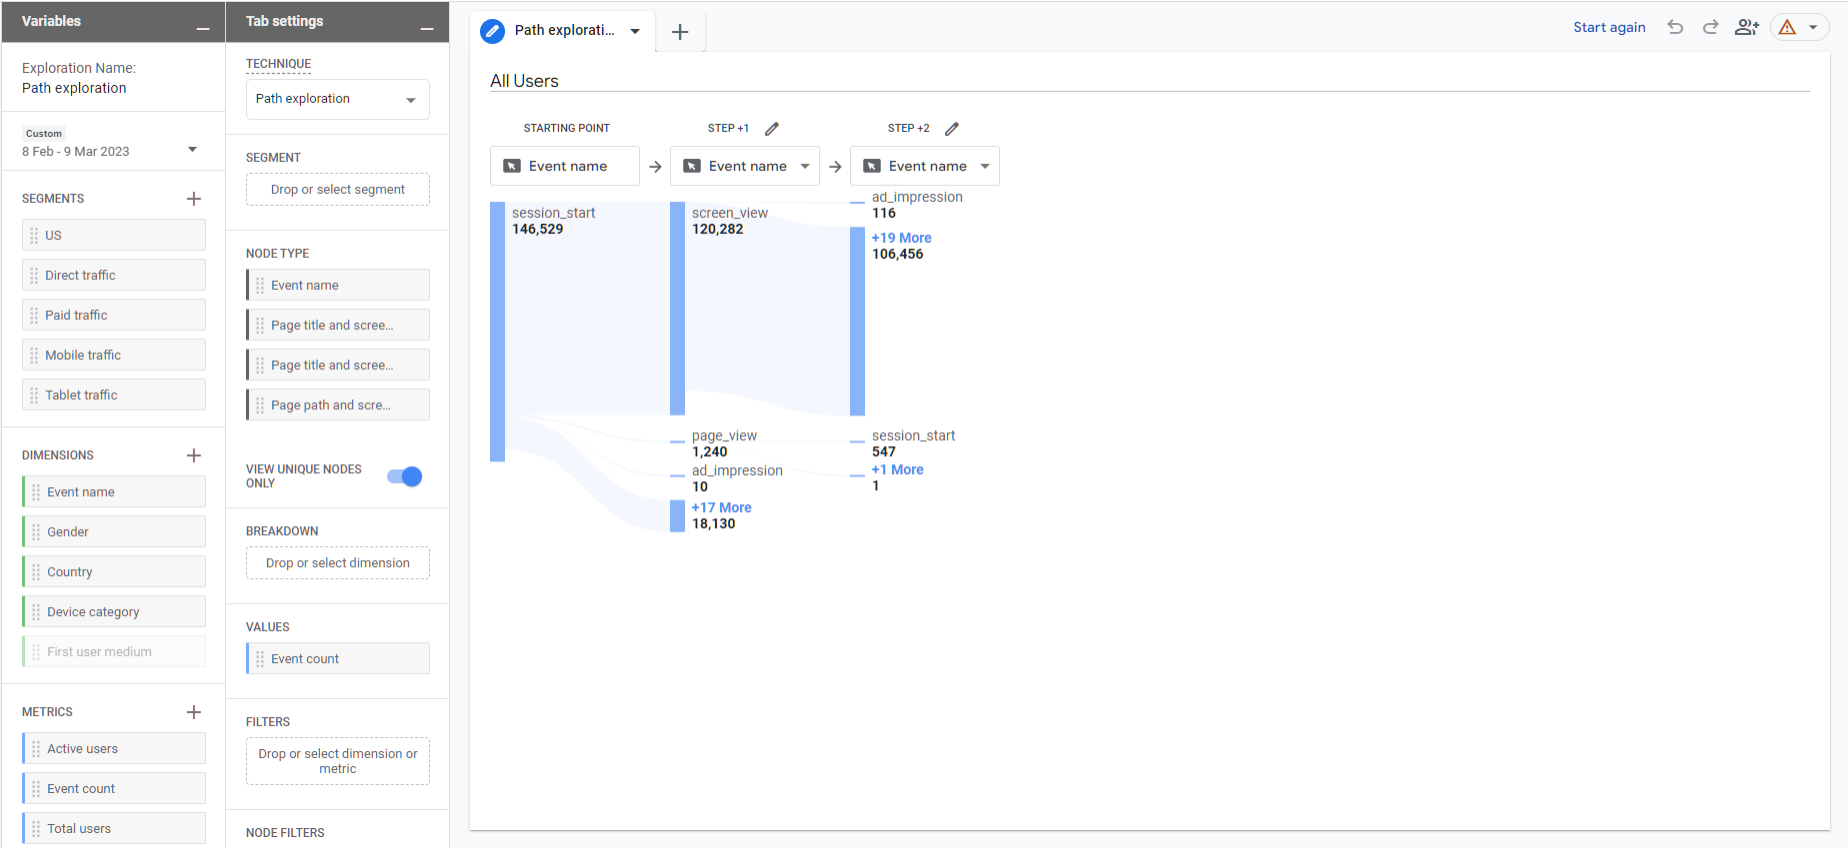
Like its UA predecessor, GA4 has a new reporting tool suite baked into the platform, including a customisable report library and saveable, accessible Explore reports.
At the same time, a quota limit has been introduced on the GA4 API into Data Studio. Therefore it is difficult (if not impossible) to build a dashboard without hitting the quota limit, which is a potential blocker for some people wanting to choose this method.
However, the new GA4 features provide fantastic opportunities for getting into the detail of your data.
The GA4 Explore reports are a similar, improved version of the Universal Analytics custom report. Though not a perfect like-for-like, this feature enables you to save your configuration, check your numbers, and return to it in a few weeks.
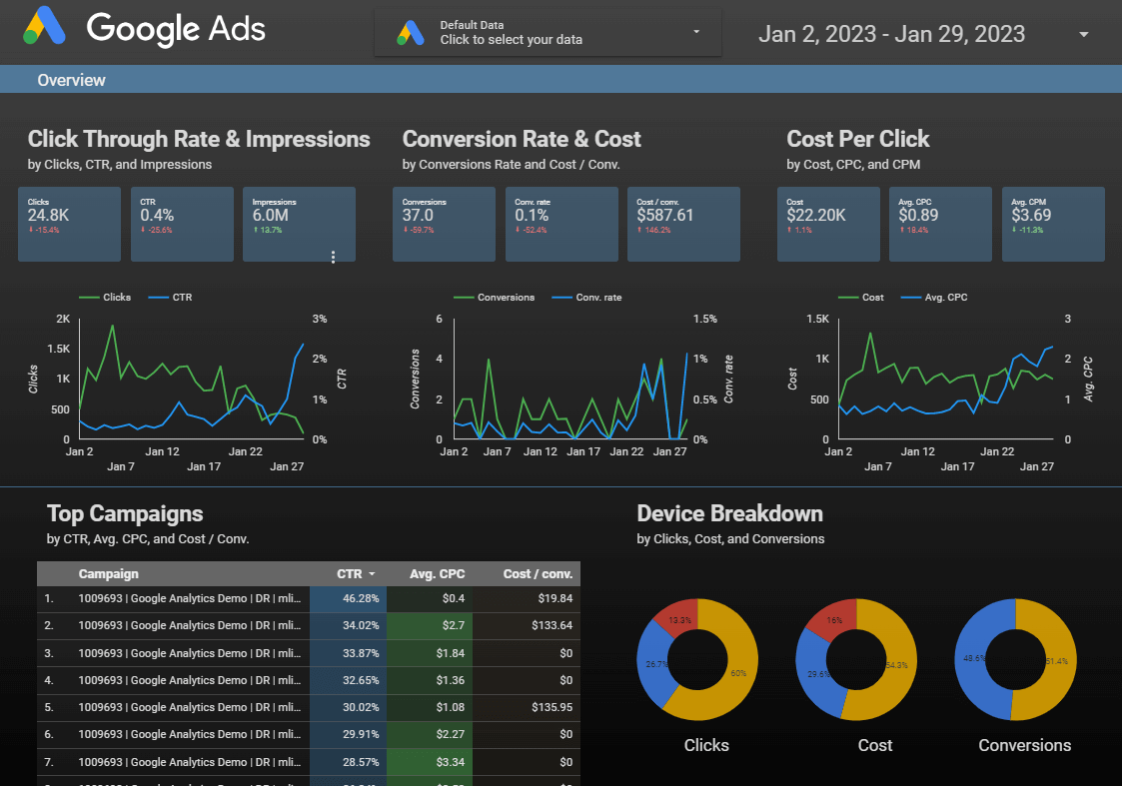
That said, we recommend using a combination of Data Studio (formerly Looker Studio) and BigQuery to build dashboards and reports, particularly when creating presentable data, monthly reports and evaluating campaigns.
What's important is you use a method that suits your needs. To help you, we've put together some of the pros and cons of either option.

Understanding the strengths of Google Analytics's Explore Reports and Data Studio can help you make more informed decisions about which tool to use for your specific data analysis needs.
Both have their strengths and weaknesses, and it's important to understand when to use each tool to maximise their benefits.