How to Create a Measurement Plan and Why You Really Need One (2026/27 Update)
- Published
- 29 September 2026
- Read time
- 14 min read
Find out how to create a measurement plan to accurately track the impact your website is having on your top-line business objectives
 Julian Erbsloeh
A measurement plan is a document that translates your top-line business objectives into dimensions, parameters, and metrics you can measure on your website. It provides a robust framework for customised web analytics configuration and forms a vital part of your broader digital marketing strategy.
The plan helps you understand how your digital channels work together most effectively to achieve your KPIs.
Why a measurement plan matters more than ever
Today, your measurement plan carries more weight than it ever has. The data you collect no longer just fills reports. It trains the bidding algorithms behind your paid media, powers your CRO testing and audiences, and increasingly feeds AI tools that summarise performance and answer questions about it. An AI assistant or a smart bidding strategy is only as good as the data underneath it. Poorly planned data means wasted ad spend and confident-sounding answers that are wrong.
Customer journeys have also become harder to follow. More happens across devices, off-site and across separate platforms such as a CMS, a CRM and a booking or learning system. Consent choices mean some of that behaviour is modelled rather than observed. A plan agreed up front is how you decide what matters most, and make sure it is captured cleanly, wherever it happens.
Yet our team is still regularly met with silence when we ask two simple questions:
What do you need your website to do for your business?
What are the critical conversion points you need to measure?
If those questions are hard to answer, you need a measurement plan. In our experience, every online business does.
Download our free measurement plan template and guide
Common Sense Planning Starts With a Question (or Two)
For us, this sounds like common sense, but you'd be surprised how the analytics and data team is still met with silence and confused looks when asking simple questions such as:
What do you need your website to do for your business?
What are the critical conversion points you need to measure?
Creating a robust measurement framework is a core element of an advanced configuration of Google Analytics 4 (GA4), usually preceded by an audit of the current setup. Without exception, every online business needs to have a measurement plan.
Many great blogs exist on the subject (Avinash Kaushik's post is an old goodie still worth reading). Google also provides many good resources on the topic, for example, in the Google Skillshop, where you can find a host of learning resources and even professionally recognised certifications.
However, we've found that good resources can be quite technical and challenging to follow for non-analysts. That's why we've decided to share our process and a free downloadable measurement and implementation plan for you to use for your website.
The measurement plan hasn't changed its job, but it now has a lot more customers. Your reports, your ad platforms and your AI tools all rely on the same data, and none of them can tell good data from bad. A well-structured plan is now the difference between AI that helps you and AI that confidently tells you the wrong thing
2.Creating your own Measurement Plan
Who needs to be involved
A measurement plan is a business document first and a technical one second. The people in the room decide whether it reflects how your organisation really performs. Make sure you have:
Someone who owns the business objectives – ideally with senior sponsorship. Board or C-suite buy-in gives the project the attention it needs to finish.
The people who use the data – marketing, paid media, product, ecommerce and CRM leads. Paid media deserves a seat, because conversions defined here become the signals ad platforms optimise towards.
An analytics specialist – someone who knows what GA4 and your tag manager can and cannot do.
A developer or technical owner – the person who will implement the dataLayer and knows how the site, apps and third-party platforms fit together.
A data engineer or data scientist – if the data will flow into BigQuery, a CRM, a dashboard or an AI tool, they should review the data model before anything is built.
In a smaller business one person may wear several of these hats. In a larger one, getting everyone together is the hard part, which is why we start with a workshop.
Using AI to help build your measurement plan
AI tools can take much of the heavy lifting out of measurement planning. They can tidy up workshop notes, challenge your KPIs, and draft the technical documents that follow the plan. Used well, they speed up the process. Used carelessly, they create new risks. Throughout the steps below you'll find AI tips like this one:
AI tip: Treat AI output as a first draft. It can structure, summarise and suggest, but a person who understands your business and your analytics setup should review and approve everything before it's used.
A word of caution: Never send sensitive or commercially valuable company information to an AI tool. That includes customer data, revenue figures, targets, pricing, unreleased plans and strategy documents. A measurement plan's structure (objectives, KPI names, event and parameter definitions) is usually safe to work with. The numbers and commercial detail around it are not, so strip them out first. If you use AI regularly, choose a business-grade tool your organisation has approved, with clear terms on how your data is stored and whether it is used for training.
Step 1 – Run a measurement strategy workshop
Bring your stakeholders together for a structured session. The aim is not just to collect a list of data points. It is to understand what each team is trying to achieve and what data would genuinely show whether the business is performing.
We typically work through half a dozen questions like:
What are the main objectives? At company, department and channel level.
Who are the key audiences? In priority order, with any sub-segments that matter, such as new vs returning or high-value vs standard customers.
What are the key features of the site or product? Tools, calculators, content hubs, account areas, and what good looks like for each.
What are the key user journeys? From first visit to conversion, and beyond it where the journey continues in a CRM, app or third-party platform.
How do you need to slice the data? By brand, region, product, audience, channel or campaign.
What is your data vision? Where you want to be in two to three years: a single source of truth, CRM integration, predictive audiences or AI-assisted analysis.
If you already have a GA4 property, audit it before the workshop. A health check tells you what you can trust today and what needs rebuilding.
Hold the workshop in person if possible, bringing key stakeholders into one room and getting them to agree on data points and priorities will get buy-in for the project and create trust in the data. If face-to-face is not an option, use something like Whimsical to run the session online.
AI tip: Record and transcribe the workshop, then ask an AI tool to sort the outputs into objectives, audiences, journeys and data requirements, and to flag anything that looks like a tactic rather than an objective. Workshops often stray into confidential territory, so remove sensitive discussion, names and figures from the transcript before it goes anywhere near an AI tool.
Step 2 – Define objectives, KPIs and data points
Create a simple grid (a spreadsheet works well) with your business objectives across the top.
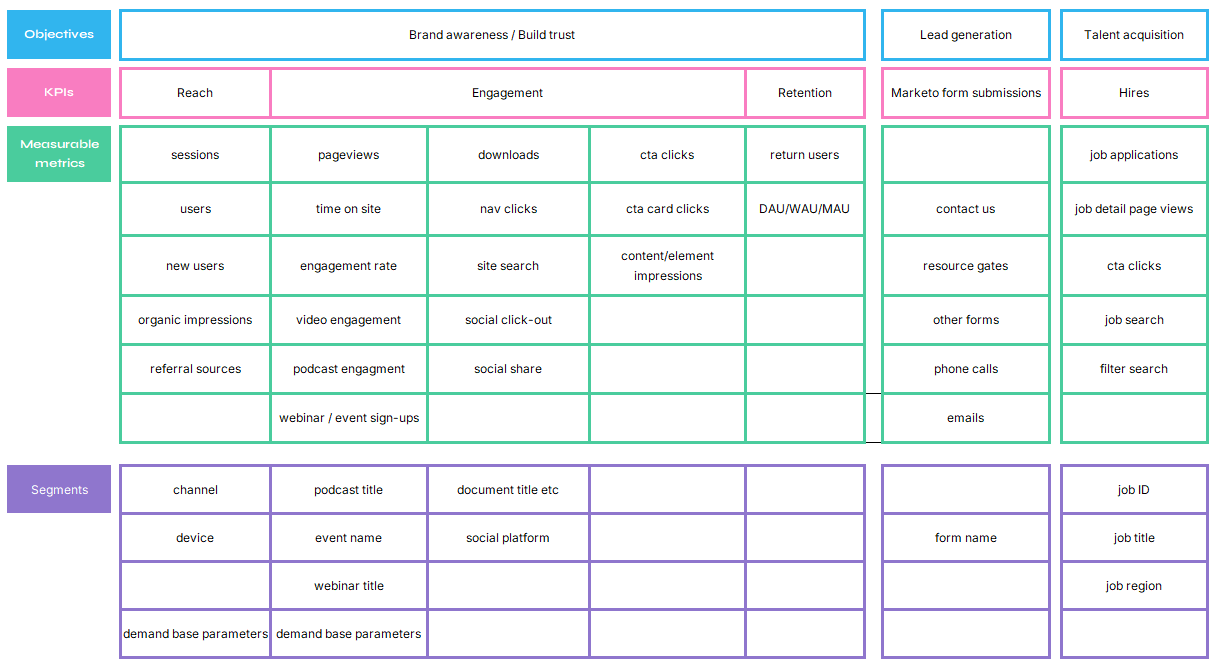
Workshop outputs are raw by design, so rationalise them (group, deduplicate, categorise) before you build your plan. Stakeholders often mix true objectives with tactics. "Grow online revenue" is an objective. "Newsletter sign-ups" is a tactic that supports it, so it belongs lower down as a KPI or metric.
For each objective, define the strategies that support it, then the KPIs for each strategy. For example, if the objective is revenue, strategies might be increasing sales, raising average order value and reducing returns. Each becomes a KPI. Then list the data points behind every KPI. A "gain new customers" KPI might rely on new users, first-time purchases and new account registrations.
Test every KPI with four questions:
What action would prove this objective is being met? If there is no direct measure, what is the closest proxy?
Is it leading or lagging? Pair outcomes (sales, leads) with the behaviours that predict them (product views, quote starts). A good plan has both.
Can it be segmented? A metric you cannot break down by audience, channel or time is far less useful.
Who owns it? Every KPI should map to a named team or stakeholder.
Flag anything your analytics platform cannot measure, such as offline sales or phone enquiries, and note where that data will come from instead. Include KPIs that sit outside of Google Analytics too, if they form an important part of the bigger picture. Worry about where you get that data from later. Then get the plan signed off by your key stakeholders. This ensures their buy-in and support, and avoids scope creep later.
AI tip: Paste in your list of objectives and KPIs and ask an AI tool to test each one against the four questions above. It is good at spotting KPIs with no clear owner, no leading indicator or no way to segment them. Leave your targets and revenue figures out: the AI needs the structure, not the numbers.
Step 3 – Structure the plan so people and AI can read it
The grid you built in Step 2 has four layers: objectives, KPIs, measurable metrics and segments. It is the starting point for your solution design, and an AI tool can now help draft that solution design from it. It can only do that well if the plan is clear and consistent. The same habits make the plan easier for your team to use, too.
Label every layer. Keep objectives, KPIs, measurable metrics and segments in clearly labelled rows, so there is no doubt which is which.
Keep the hierarchy intact. Each metric should sit directly under the KPI it supports, and each KPI under its objective. Segments should sit under the metrics they break down, so it is clear that job ID and job region apply to job applications, not to everything else in the plan.
Use specific names. "Marketo form submissions" says far more than "leads". Naming the platform also makes it clear which data lives outside your web analytics tool.
Explain anything internal. Add a short note or glossary for terms that only make sense inside your organisation, such as what counts as a resource gate or which Demandbase parameters you want to use.
Share the file, not a picture of it. An AI tool reads a spreadsheet export more accurately than a screenshot or a slide.
Keep technical detail such as event names, triggers and parameter values out of the measurement plan. That belongs in the solution design, the next document in the chain.
If your website or business has very distinct audiences, it makes sense to add an audience layer across the very top of the measurmenet plan, to define objectives followed by KPIs etc per audience. My favourite example for where this makes perfect sense is an estate agent's website. Here, you have buyers, sellers, landlords and tenants all visit the same website with very different objectives. If this applies to your website, split them out.
Fresh Egg were brilliant to work with. The team were incredibly knowledgeable, professional, and easy to collaborate with. They guided us through every stage of the project, from the initial health check and strategy workshop through to the measurement plan, solution design and implementation. Everything was clearly explained, well organised and ran really smoothly from start to finish.
Step 4 – Map audiences, journeys and segmentation
With the framework agreed, work out how you need to cut the data. This is where most advanced requirements surface, and most of them need custom parameters, so they must be planned now rather than bolted on later. Typical questions include:
How do we report on membership tiers or subscription levels?
How do we analyse product categories by season, and tell whether an item was bought in the sale?
Which audiences do we need to build, such as cart abandoners, loyal customers or users likely to churn?
Where does the journey leave the website, and how do we follow it? Think cross-domain tracking, logged-in areas, booking engines, learning platforms and CRMs.
The answers become your custom events, parameters, dimensions and metrics. They also shape your data model: the structure of event names, parameters and values your analysts and AI tools will work with. Getting this right early is so important that we wrote a separate guide to creating a robust GA4 data model.
Pro tip!
Identifying the users of the data around the organisation and involving them in the process early will go a long way in creating trust in the data, ensuring that everyone feels heard and that nothing important is missed. Find out what data they need in order to do their job to the best of their ability and work backwards from there.
Step 5 – Plan where the data needs to go
This is the step most plans still miss. GA4 is rarely the only destination for your data, so decide up front what it needs to power:
Reporting – which KPIs appear in dashboards, and whether they need blending with CRM, sales or media spend data.
Paid media – which conversions go to Google Ads, Microsoft Ads and paid social, and whether they carry a real value. Feeding back CRM outcomes and offline conversions lets platforms bid for your best customers, not just the easiest form fills.
Your data warehouse – we almost always recommend the daily GA4 export to BigQuery. Raw data is faster and more accurate to report on, blends easily with other sources, and removes the guesswork of GA4's own modelling. It also includes anonymised, cookieless pings from users who decline analytics consent, where Consent Mode is set up. Our guide to the GA4 BigQuery export schema explains what you can do with it.
AI and analysis tools – AI assistants that answer questions about your data are only as reliable as the data model underneath them. Our own analytics agent, Inspectre, lets teams ask questions in plain English and get answers straight from their BigQuery data. It works from a cleaned, structured reporting table rather than raw GA4, so every answer inherits the event names, definitions and channel logic set out in your plan. Vague event names or undefined parameters don't just make reports messy. They make AI answers wrong, and AI will present a wrong answer just as confidently as a right one.
Your data engineer should review the model against these destinations together with the paid media person before it is built. The paid media team is a key stakeholder in this process.
Step 6 – Turn the plan into a solution design, dataLayer brief and build
The measurement plan says what to measure. The solution design says exactly how: every event, parameter, naming convention and GTM configuration, documented in one place. It becomes the living record of your setup. Our solution design template is included in the measurement plan download document.
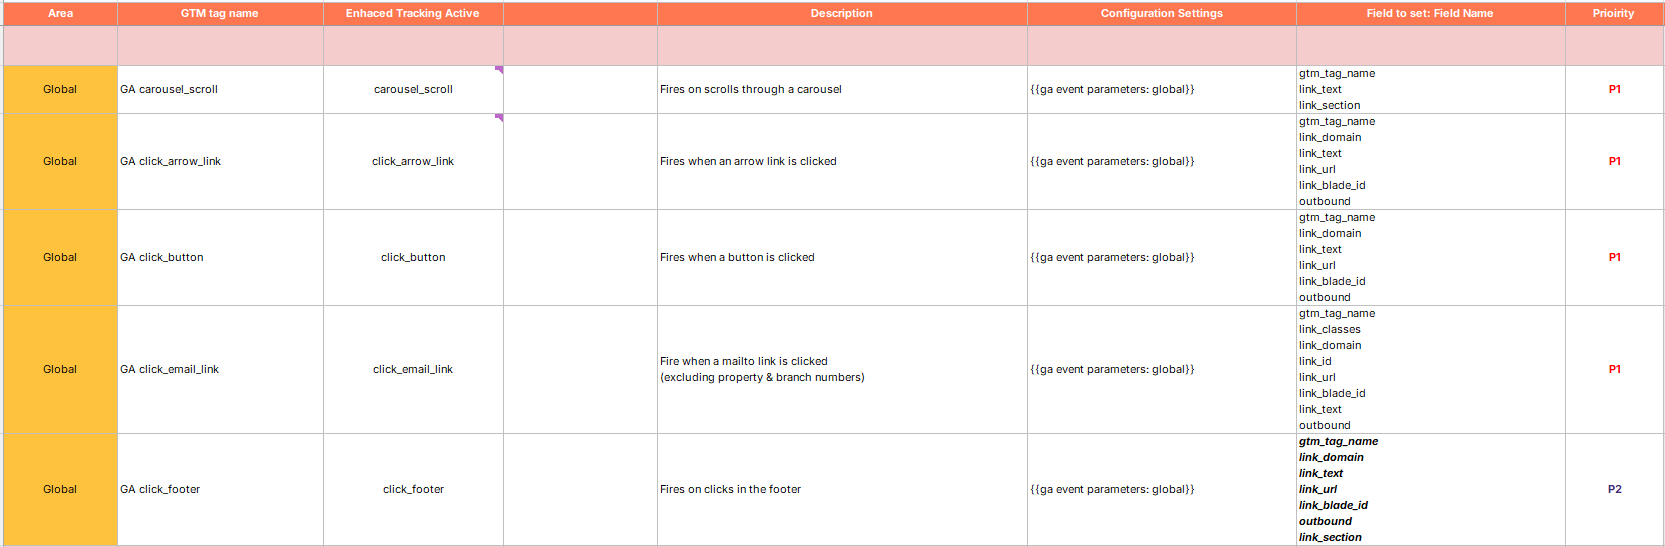
Next comes the dataLayer brief: clear instructions for your developers on which dataLayer pushes should fire, when and with what values. The dataLayer is the most robust way to power tracking. Because the same foundation feeds paid media platforms, CRO tools and more, it pays off well beyond GA4.
Implement through a tag manager such as Google Tag Manager rather than hard-coding tags. It makes future changes faster and protects your tracking through site migrations.
Finally, QA every data point. We test in a separate GA4 property or debug environment before switching data into your live reporting property, so inaccurate data never pollutes your history.
AI tip: Ask an AI tool to generate a QA checklist from your solution design, listing every event, the page or action that should trigger it, and the parameter values you expect to see. Working through it in GTM preview mode and GA4 DebugView makes testing faster and more thorough.
Step 7 – Agree reporting and keep the plan alive
Decide what each audience needs to see and how often. Smaller sites can often cover every KPI with GA4's standard reports plus a scheduled Explore report. Most of our clients need more: custom dashboards in Google Data Studio or Power BI, usually built on BigQuery, with regular analysis on a weekly, monthly or quarterly basis.
Then treat the plan as a living document. Your business, your website and the platforms themselves will keep changing. Review the measurement plan at least annually, and whenever you launch a new site, product or platform. Keep the solution design updated with every change. With GA4 setups more customised than ever, accurate documentation is what stops them decaying.
AI tip: Once your data is flowing into BigQuery, an AI analytics agent such as Inspectre can answer the ad-hoc questions dashboards never cover, like "what drove last Tuesday's traffic spike?". Keep your measurement plan and solution design current, because they define what the agent understands about your data.
Want to create your own Measurement Plan?
What Next?
If you need help creating and implementing a measurement plan, we can help. We offer various services related to digital analytics, data engineering, analysis, reporting, and business insights, which we would love to discuss with you.
Get in touch to learn more about how we can help you and your business extract valuable, actionable insight and get a step ahead of your competition.
Get Fresh Thinking and stay ahead of digital marketing trends
Subscribe to our newsletter and receive exclusive invites to our helpful knowledge-share events; curated news roundup of pertinent and topical industry news... and early access to our industry resources and insights.