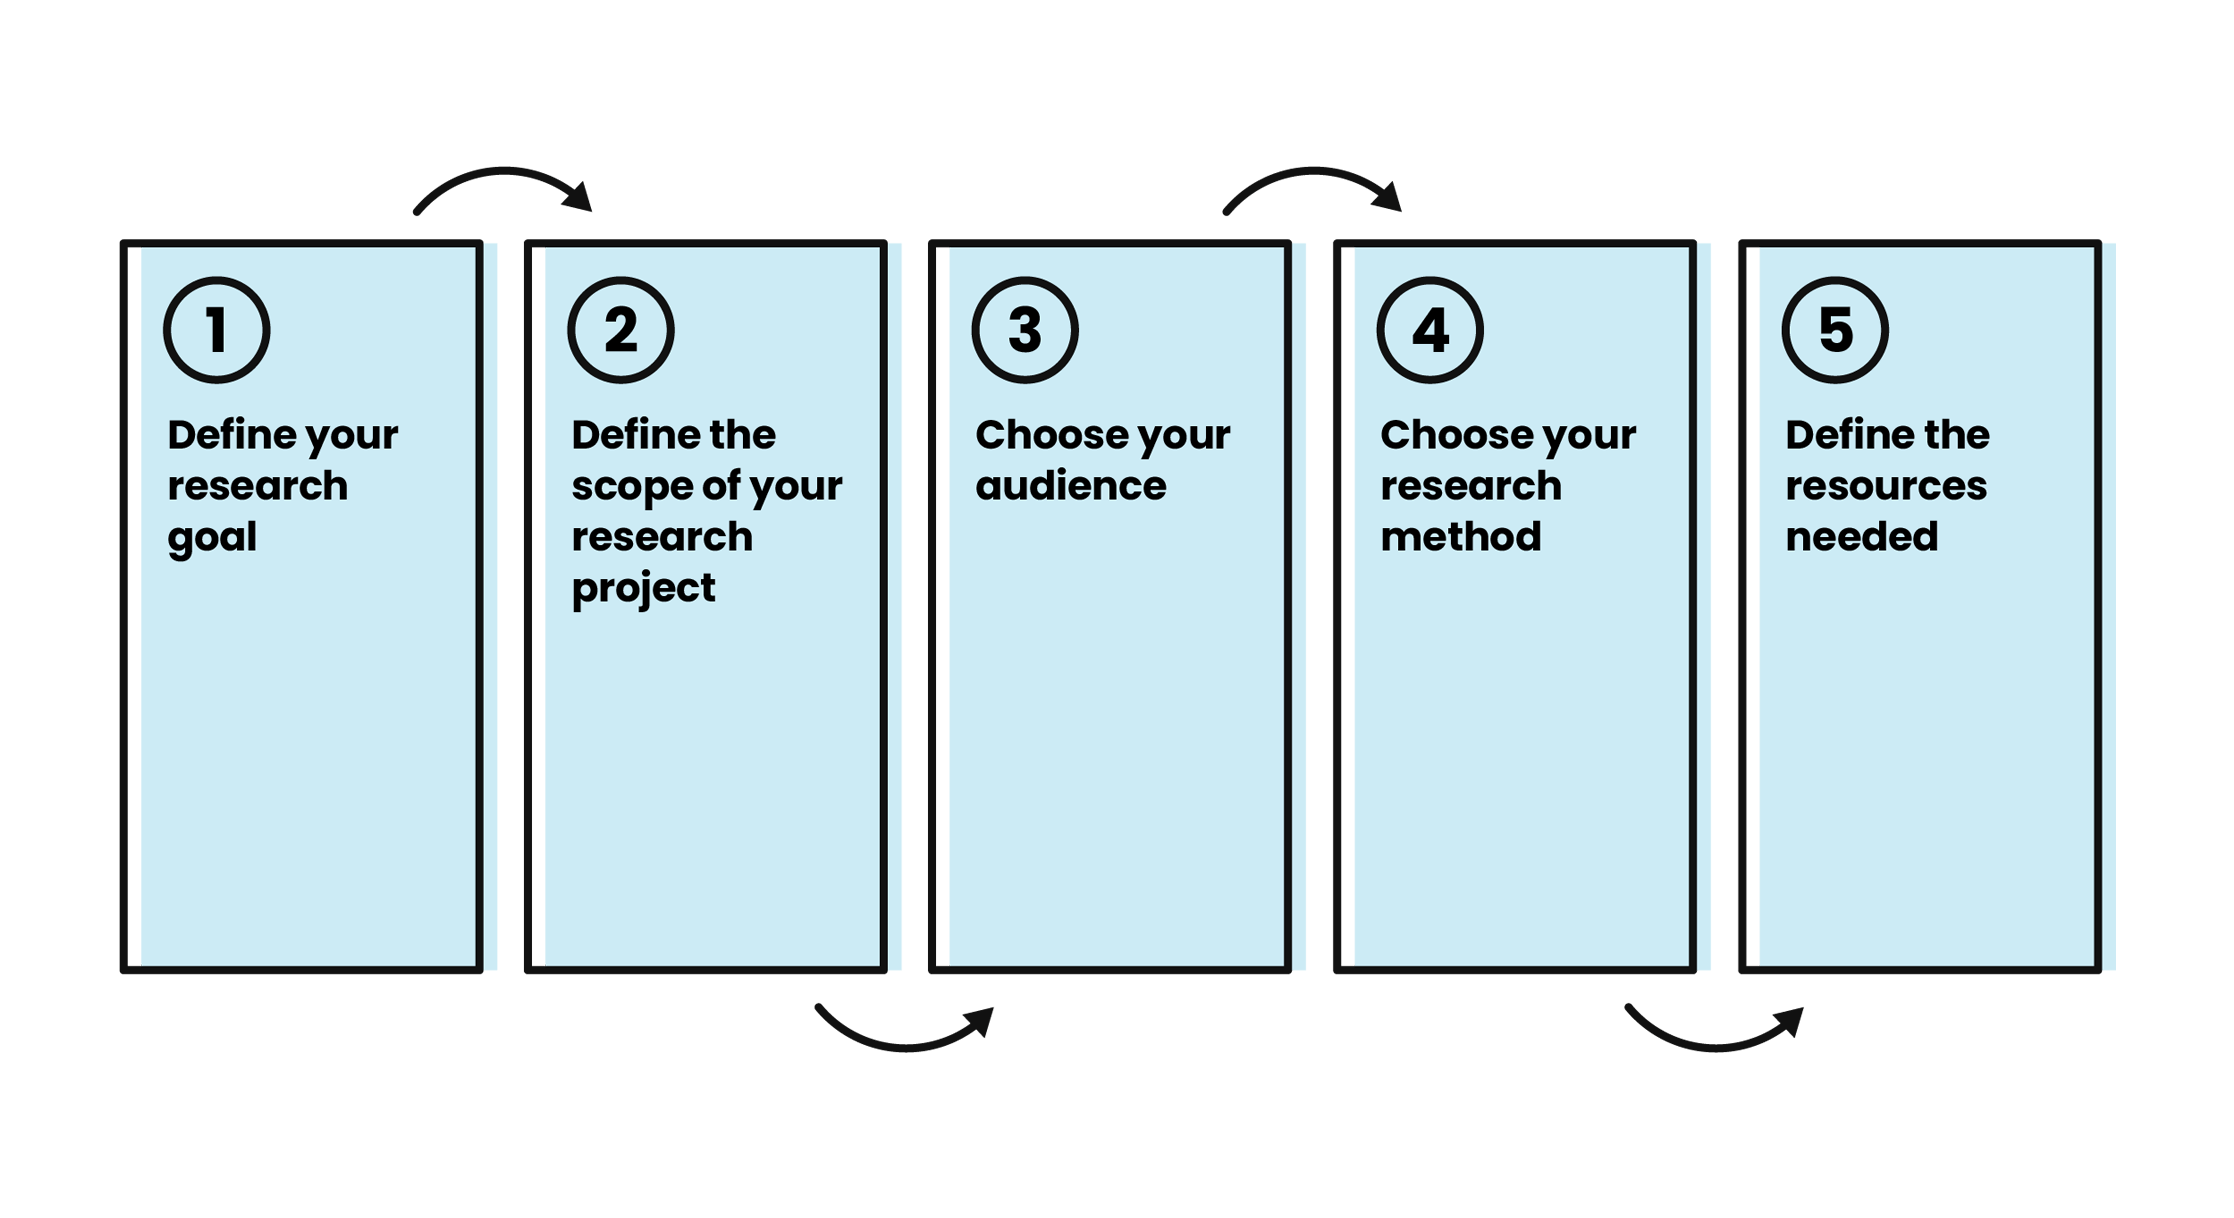
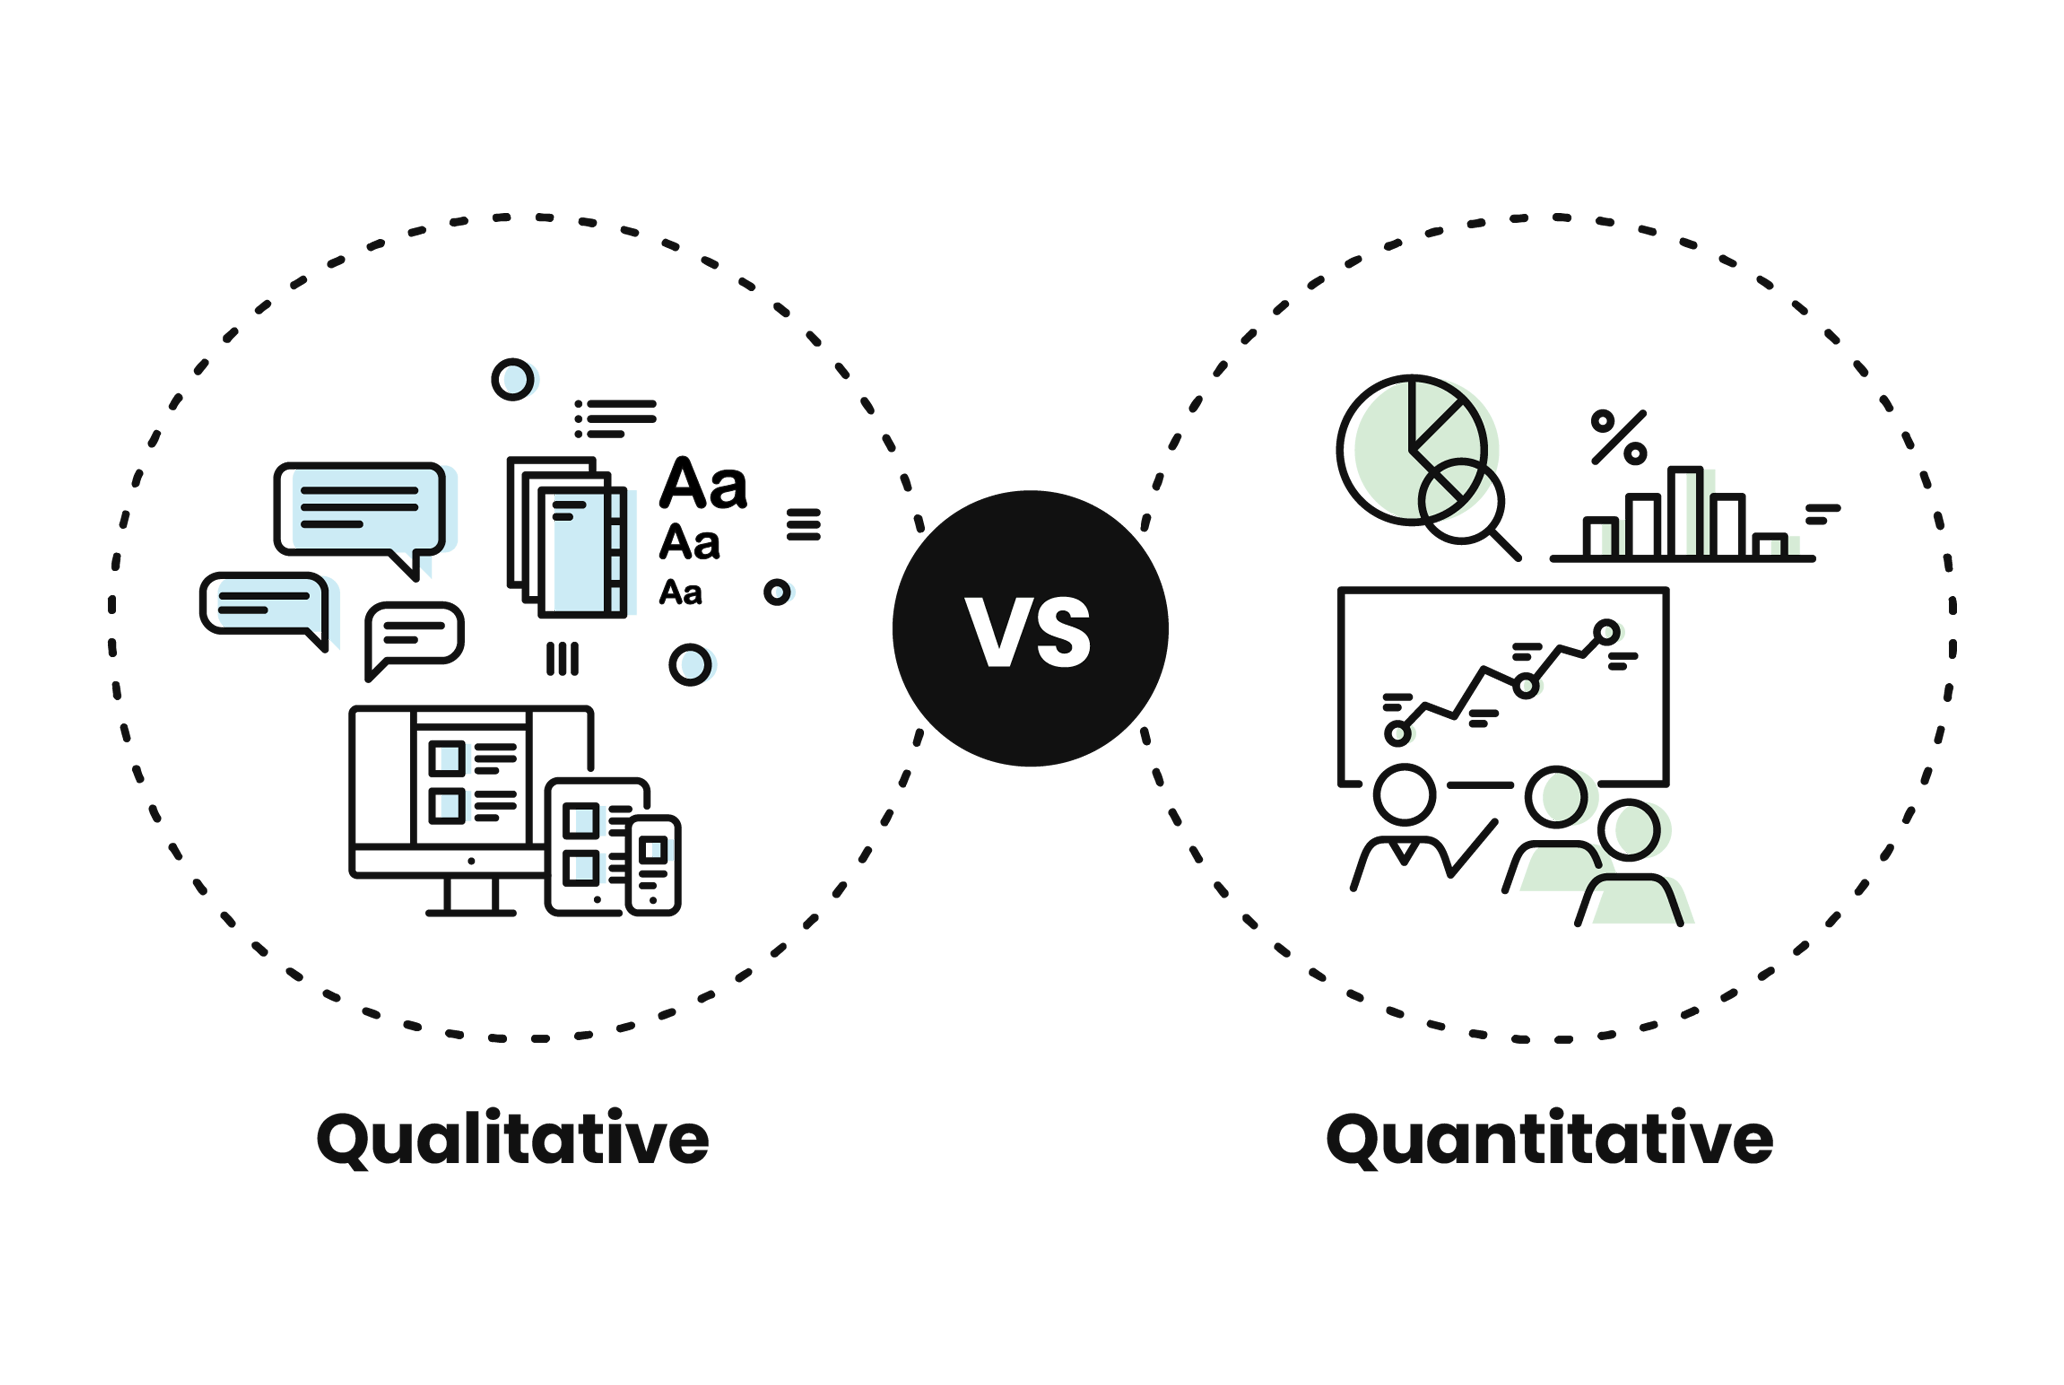
There are typically two types of data obtained through audience research; quantitative and qualitative. One is numbers-based, and the other is more descriptive. It's relatively simple to remember them through their names:
- Quantitative derives from the word 'quantity', meaning an amount or measurable.
- Qualitative derives from the Latin word 'qualitas', meaning 'quality' - therefore, it is about the quality, not the quantity.
Quantitative
Quantitative data can be counted, measured and expressed using numbers.
You can generate the findings through:
- Website metrics
- Surveys (closed questions such as 'yes/no' or numerical scales)
- Tests and experiments
Qualitative:
Data that is descriptive, conceptual and non-statistical.
You can collect qualitative information through:
Both types of data help us to understand the fuller picture. Quantitative data gives us the 'what'. It shows us what people are doing. Qualitative data gives us the 'why' as we get more feedback style data through asking questions and interacting.
Can you perform effective audience research with one quantitative/qualitative data set only?
Many research studies will often use either quantitative or qualitative data because one suits the thing you're trying to test or the question you want to answer better. For example, if you want to understand the "why" in a situation, you might be better off using qualitative data.
Should you combine qualitative and quantitative data?
Combining the two is not uncommon. A word of caution - make sure you sense-check that mixing them will not confuse the results in some way or lead you to draw the wrong conclusions.
360 audience analysis brings audience research and advanced data analysis together to give you a complete picture of your audience.
It taps into the hidden detail in your analytics and CRM data to uncover where your audiences research, what they click on, where they stall – and why they do it.
What information do you need to understand about your audience?
Critical knowledge to harvest includes goals, bounce rate, conversion rate, and spending power. You can ask the following questions, for example:
- What is happening in the customer and user journey
- Where are people dropping out?
- Does the audience like your message? Is it clear?
- How do they feel about your brand?
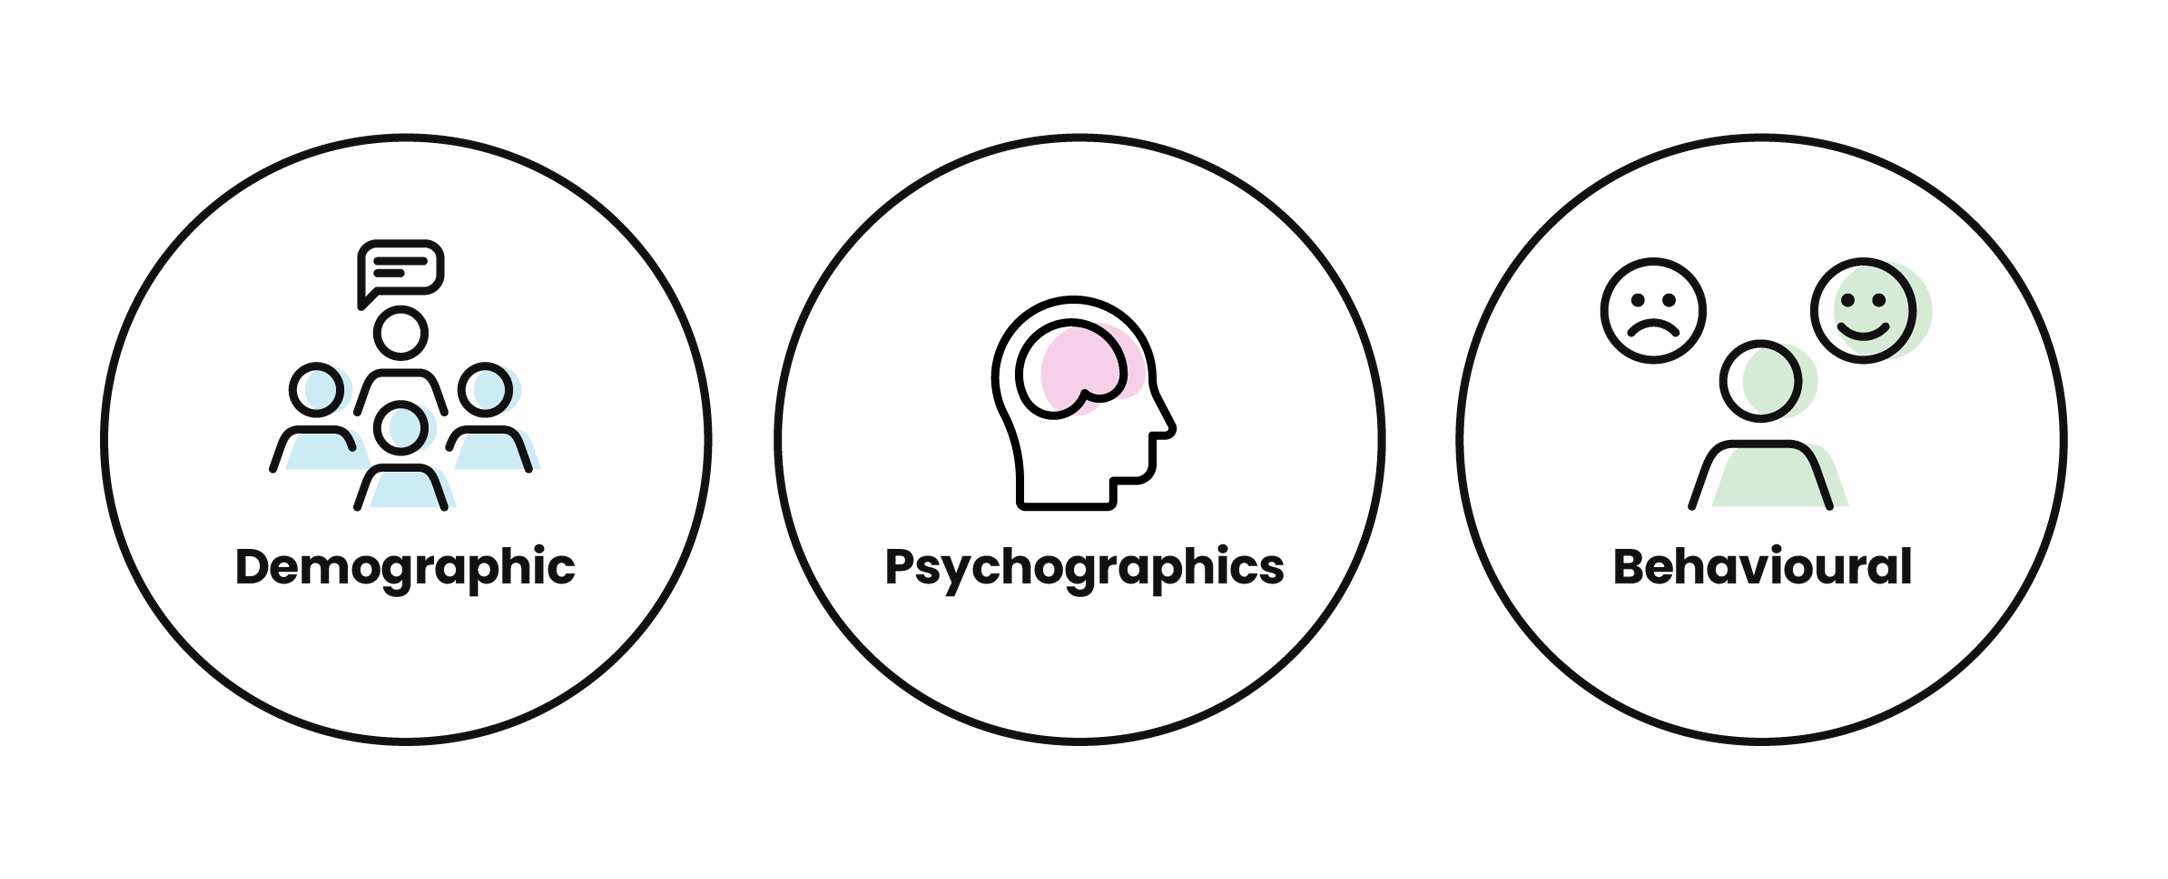
You can then break the results into three separate areas, each of which can then be segmented.
Demographics
Demographics are typically statistical data sets that characterise a particular group of people (such as a persona or audience group).
Demographic factors:
Typical factors to be collected and analysed include:
The information provides more factual data on who and where people are.
Example data sources:
CRM/database
Website analytics (e.g., the Google Analytics 'Demographics and interests' report)
Social media (Facebook, Instagram, TikTok, Twitter, LinkedIn)
Customer surveys
Psychographics
Psychographics is the study of customers relating to their beliefs, opinions and life goals. These can be connected to culture, religion, socioeconomics, or other social groups.
Psychographic factors include:
Values
Interests
Opinions
Attitudes
Goals
Motivations
Needs
Example data sources
Social media
Website analytics are browsing data
Customer surveys and questionnaires
Interviews
Focus groups
Brand awareness and preference surveys
Collecting this information is both valuable and helpful. It curates an idea of your audience and users' needs, wants, and goals. To obtain it, speak to them in interviews and focus groups. This way, you can listen to what they are saying, get a feeling for their genuine feelings and dig down into people's values, attitudes, and beliefs.
Behavioural
Behavioural data is how people act or behave when attempting to do something in a digital setting. The information gathered will typically reveal how users engage with your product or service, website, app or across a whole journey.
Behavioural factors include:
The information gathered tells us more about what people are doing, their actions, and what they are looking for. Comparing this to the psychographic factors is interesting as there is often a difference between what people say and what they do.
Example data sources
Website analytics
Search data (Google Search Console/Google Analytics)
AdWords and Bing Ads data
Call centres/customer support queries
Heatmapping
Eye-tracking/facial expression tracking
Product/service reviews and feedback
Tools to help you understand audiences
So now we have an understanding of what information we want to obtain, we can look at which tools you can use to complete your research and what you get from each of them.
Primary vs secondary research
When it comes to tools to help you gather knowledge of an audience, it helps to understand the difference between primary and secondary research.
Primary research is information gathered through fact-finding tactics that you conduct yourself. Research types include surveys, interviews, observations, data analysis and focus groups. The data is collected and obtained 'first-hand'.
Advantages | Disadvantages |
100% ownership of the data. Accountability for the authenticity of the data Flexibility in research methods to match specific needs.
| |
Secondary research is information gathered from previously conducted research studies. Examples include published books and articles, commercial information sources, government agencies, educational institutions and academic peer-viewed journals.
| Advantages |
Disadvantages |
- Allows completion in a limited time and with limited resources
- Prevents knowledge repetition by mapping out existing research
- Helps interpret primary data more effectively.
|
- Relevance and timeliness of data
- Careful validation of credibility
- Lack of specificity.
|
Whether you choose to do primary or secondary research, and in which order, depends on your needs. Typically, secondary research is done first, followed up with primary research. This way, secondary research gives you the bigger picture, and you can follow it up with primary research to plug the gaps or delve deeper. In this guide, we will focus on primary research.