
Why You Should Be Using Analytics To Inform Your UX Work
The importance of analytics to a business cannot be understated. Data can highlight what has performed well and can be used to inform UX decisions in the future. An ‘analytics first’ approach should help lay the foundations for solid, measurable improvements. Taken from my book: Researching UX: Analytics, I will be covering some key advantages of using analytics for your UX decisions.
How analytics helps with UX
User Experience, or ‘UX’, describes the process of reducing the friction between the task that someone is trying to accomplish and the tool that they’re using to complete the task. People often talk about how ‘user-friendly’ something is, and this is broadly similar to UX.
UX practitioners practice a set of methods and techniques for researching what users want and need. A lot of the time these methods are based on qualitative evidence. This includes methods like observations from usability testing or findings of field research.
Using only qualitative evidence though means overlooking a huge amount of quantitative (quant) data that may be available to you. Quantitative data is primarily numerical and can be measured. This is often used in the form of website analytics and can be even more compelling that qualitative evidence.
The table below shows the main differences between qualitative and quantitative data.
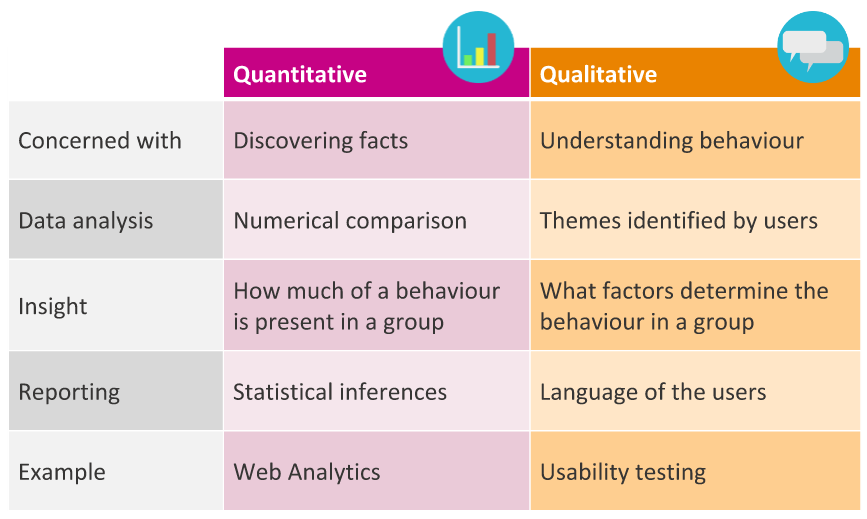
It's not a case of using one form of research and analysis, quant and qual go hand in hand to give a rounded picture of the overall user experience. The following diagram shows where analytics can fit into the UX process.
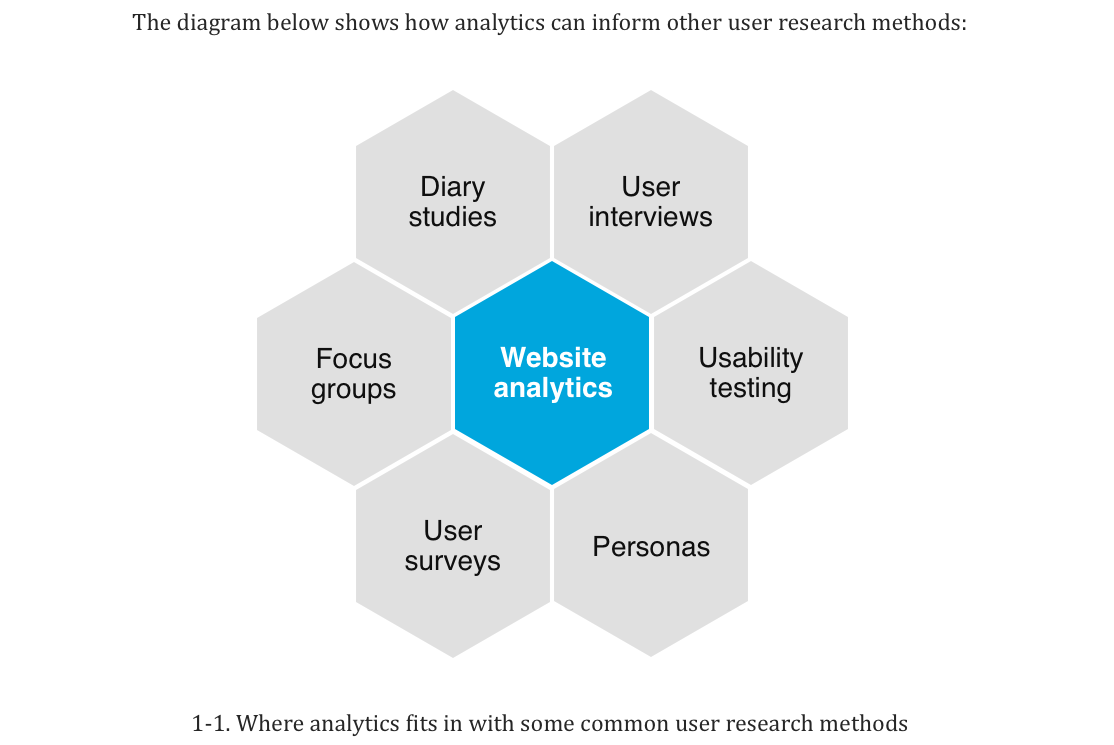
Picture credit: Tim Minor
As the diagram shows, the landscape is made up of both qualitative and quantitative methods. Both make up crucial parts of user experience research and design. They give different forms of insight which are crucial for getting a rounded picture of the user experience of a website or app.
Put simply, the quant side of things will generally tell you *what* users are doing on a website, the qual side of things will help you to find out *why* those things are happening.
Advantages of using analytics in your UX process
Web analytics should be a vital part of your UX process. You may not be aware of all the reasons why you should include a quantitative approach to your work though. In this section I'll cover five advantages of using analytics information to shape your UX recommendations.
1. Analytics gives facts that are hard to argue with
The data that comes from website analytics software is not subjective in the same way that qualitative data often is. While forms of qualitative research are open to interruption, the metrics used in website analytics are more black and white. This leads to fewer arguments about the findings.
As this quant data is definitive it also makes it perfect for measuring the impact of changes. If a design solution to a problem is implemented then it can be measured by analysing the changes in user behaviour before and after the change was made. This makes it easier to prove your point and show the value of your work.
2. Analytics gives fast results
Using analytics can often give an almost instant answer to a question. Other user research and methods can take days or weeks to see results but with quantitative data it can just be a case of opening your analytics package and navigating to the right report. As mentioned previously, I'm not advocating using only a quantitative approach, but if time is short it may not even be possible to use other UX methods. You can get a good overview of user behaviour on a website within minutes using the right analytics tools and techniques.
3. Analytics gives unique insight
There is a huge amount of information available from your web analytics package. In Google Analytics alone there are around 80 different standard reports made up from over 400 different dimensions and metrics, and that's before you event start to create your own reports. No other UX methods can give you as much data.
Also, as website analytics are constantly collected you have a full overview of how a website is being used over time; other methods tend to only show a snapshot of how users are engaging with a site over a particular period. Analysing data that has been consistently collected over time gives much more insight than 'one-off' studies.
4. Analytics combines well with other UX methods
As you'll find out later on in this book, analysis of your analytics data can fit in at various points during your UX process. Data sourced from your analytics can pinpoint problem areas on your website which can then become a focus for usability testing, heuristic assessments or any other form of qualitative research for that matter
Demographic information can also be taken from analytics to help build up your personas and to provide the basis for user research or usability testing recruitment. If you're evaluating user journeys then website analytics can play a central role in showing you how people are currently navigating your website. Finally, as touched on before, analytics data can be used to measure the impact of any design changes that you make. Analytics data can enhance almost every aspect of your UX work!
5. Gives an effective way to present your findings
Presenting findings of UX work to stakeholders can be difficult. Getting across the results from long-term field studies, for example, in a way that stakeholders can relate to can be a challenge. Analytics data naturally fits into presentations. This relates to point 1, that analytics data is hard to argue with. The 'black and white' nature of analytics means that you have 'hard' data to show stakeholders and clients. This can be particularly useful for demonstrating the difference that your UX efforts have made, and even showing the ROI of your work. Also, clients and stakeholders love a graph!
In summary
There is a lot of information in your analytics that tells you how your users are engaging with your website. This data alone is not enough to base your design decisions on, but it should help inform the focus of further user research.
In my next post I'll be talking about where to start when it comes to analysing your data. I'll cover some key tips which should help you to find practical uses for the reports in your analytics package.
If you can't wait until the next post, take a look at our CRO page or contact us if you need some help connecting your data to your UX work.