
How to start tracking data in GA4 in five easy steps, and why this matters

By Sam Dunkley|13 Sept 2021
Analytics and data | 7 MIN READ
It has been almost exactly one year since we published a blog post announcing the arrival of GA4, the 'new era of web analytics'. At launch, notable new features included a new, more dynamic data model, machine learning features for churn prediction, and data-driven attribution. Read on and learn how to start tracking data to use these new features in a few easy steps.
The learning curve for GA4 is steep, and kicking the can down the road won't make it go away. Eventually, support will diminish for your trusted Universal Analytics platform, and new functionality is already only available on GA4, so the sooner you start working with GA4, the better.
Sam Dunkley, Senior Web Analyst


So what has changed since its introduction?
If I'm candid, not a great deal has changed in GA4. While just about half of our clients are, as per our recommendation, running GA4 in parallel to their existing Universal Analytics setup, very few of them are using GA4 regularly to look at their data.
We also fall back on the trusted Universal Analytics when we need to understand user behaviour or channel performance better. So why is it that this new platform does not seem to be widely adopted a year after launch?
During the last 12 months, Google has put an immense amount of resources into developing GA4. We have seen new features emerge almost every month, supported by resources on implementing and using them. However, there is still some confusion and hesitation about adopting this new platform because it is very different.
One aspect that has undoubtedly improved is the effort involved in getting started. It has never been easier to get started with this new version and use the features to draw immediate value from the available features. If you are still not using GA4 (and I am sure you know you should be), read on and learn how to start collecting data.
The learning curve for GA4 is steep, and kicking the can down the road won't make it go away. Eventually, support will diminish for your trusted Universal Analytics platform, and new functionality is already only available on GA4, so the sooner you start working with GA4, the better.
Migrating now is a relevant risk mitigation exercise. While Universal Analytics probably won't disappear for years, you will need some historic data in GA4, and you will need to learn how to use it!
To help you with this, we have put together a quick guide on 'how to get started' below.
There are already some excellent guides on getting started with GA4, and we have linked to our favourite resources. So, knowing you should migrate to this new platform, there is no excuse. Put the kettle on, free up the next half hour in your calendar and start collecting data with GA4.
How to start collecting data in GA4 today
For this, we assume that you already have Universal Analytics setup (so you have an existing instance of GA), and you are using Google Tag Manager to collect that data. We further assume that you have edit/publish rights for both of these platforms.
If the above statements are all true, getting some data flowing into your GA4 property is easy, following these steps:
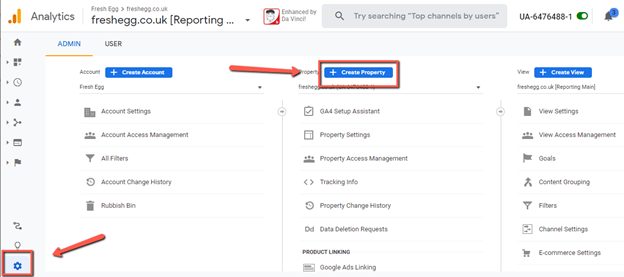
Create a new GA4 property within your GA account
In the Admin section of your existing Google Analytics account, hit the 'Create Property' button.
GA4 is now the default option when creating a new property. Make sure to set the time zone and currency correctly at this stage – these should match the settings in your Google Ads accounts.
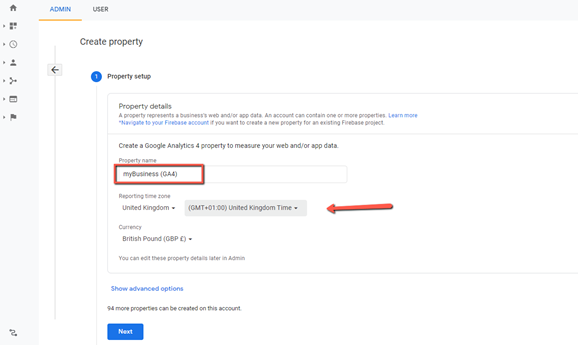
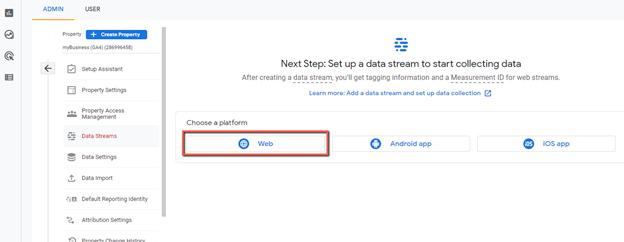
In the next step, you select what type of data stream you are setting up. GA4 was initially known as 'Web + App' because the data model allowed cross-platform analysis and modelling. I'll presume you are setting up a webstream in this instance, so select the appropriate option and hit 'next'.
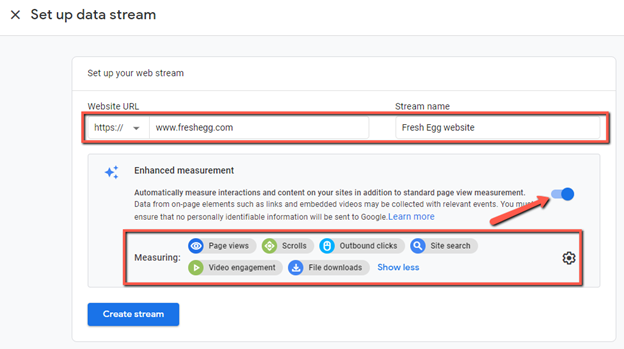
Create a new data stream
After setting your URL and a name for the data stream, you can enable the ‘Enhanced Measurement’ feature. This feature will automatically start tracking several relevant metrics once you have added the tag to every page of your site.
This addition is a significant improvement as you can track several interactions with a single tag (in GTM or using the gtag), including:
- Pageviews
- Scroll tracking
- Outbound link clicks
- Site search
- Video engagement (play, pause, progress)
- File downloads
If you want to track some but not all of these, click on the little cog icon and deselect the ones you do not want to include at this stage.
Once you have created the new data stream, GA will present you with the following screen, from which you copy the Measurement ID for the next step.
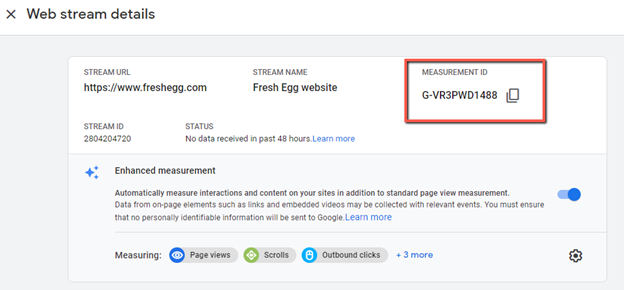
That’s all you need to do within the GA4 interface for now. Next, open up Google Tag Manager.
Create a GA4 Config tag in Google Tag Manager
In GTM, create a new tag and select the GA4 Config tag from the list of native tags.
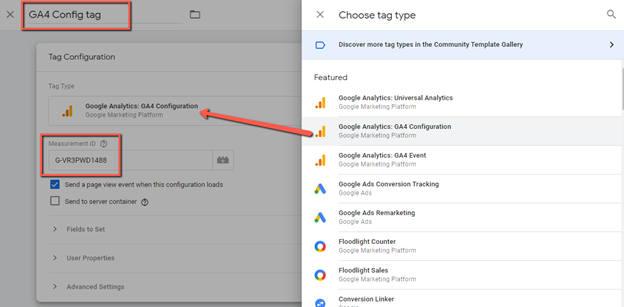
Name the tag appropriately so that you can recognise it not only amongst your other tags but, more importantly, during debugging in preview mode. Since we have multiple tags firing on our site, I have added the Measurement ID to the tag name. This step might not be necessary if this is the only GA4 config tag on your website.
Paste the Measurement ID you copied in the previous step into the field.
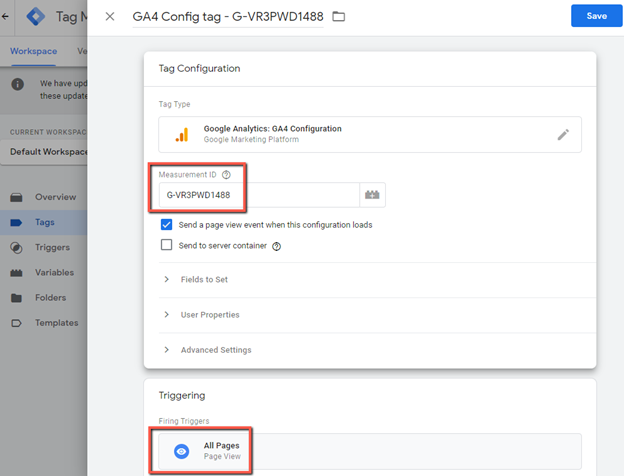
'Send a page' view event when this configuration loads' is ticked by default. Keep this ticked if you want to track pageviews automatically. The exception would be on a single page application; for example, Add the 'All Pages' trigger and then hit 'Save'.
Preview/test/publish
One of the great new features of GA4 is the in-built DebugView in the user interface. To start debugging, hit the ‘Preview’ button in the top right corner in Google Tag Manager. Do not submit/publish at this stage! There are several ways to debug new tags in GTM, but we will use GTM’s preview mode for this post, which automatically shows your data in the DebugView in GA4. 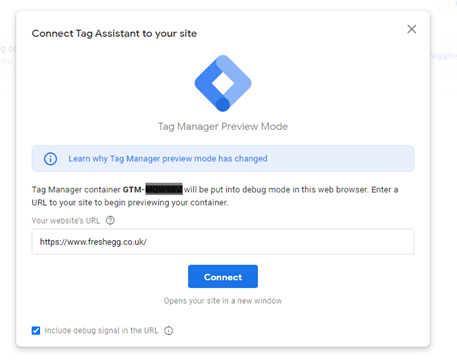
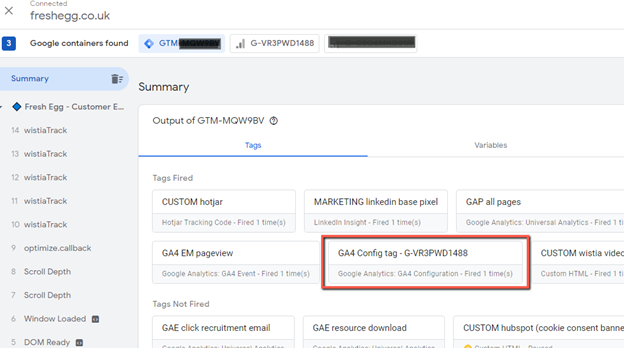
The first thing you check for when the GTM preview has loaded is that your newly created GA4 config tag is firing.
Now head over to GA4 and fire up the Debug report. You will find this within the ‘Configure’ section in the left-hand menu in the GA4 interface. At this stage, it is useful if you have multiple screens available as the new debugger takes up an entire screen.
Selecting the website on one screen, watching the Tag Assistant debugger on another, and seeing the data roll into the GA4 DebugView on a third screen is ideal, but you can achieve the same by moving back and forth between these screens.
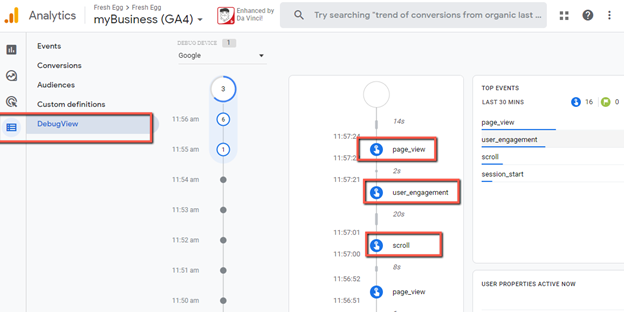
You can click on each event in the vertical timeline to get additional data such as parameters or user properties that we are sent with each respective hit. The very basic implementation we just walked you through will not populate much additional info here.
Now follow a few user journeys across your site. If you have enabled Enhanced Measurement for this data stream, check if scrolling, video interactions and pdf downloads are tracking as expected.
If you are happy with the data coming into your GA4, head back to Google Tag Manager and publish your changes by hitting the blue ‘Submit’ button in the top right corner.
Finally, there are a few more configurations you should enable as soon as you have set this up.
- Data Settings (via the Admin panel)
- Data Collection: enable Google Signals and set your preferences for personalisation
- Data Retention: this setting is set to two months by default; we suggest changing this to 14 months
- Data Filters: exclude internal traffic and debug mode; the functionality here is pretty limited at the moment - fingers crossed for some more effective filters in the future
- Configure (via the left-hand menu in the UI)
- Conversions: any event can become a conversion with the simple flick of a switch; activate the ones that are relevant to your business
- Product linking (via the Admin panel)
- Link your Google Ads account, so you can see cost data and create marketing audiences
- Consider setting up the data stream to Google Big query – this is a whole different beast, and you should know what you are letting yourself into.
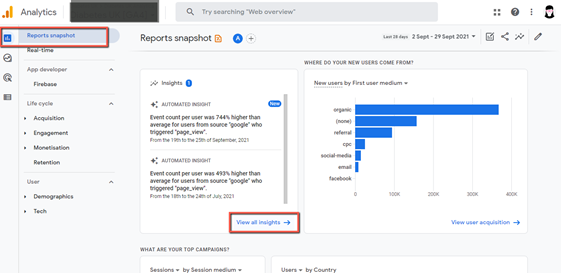
- Enable Anomaly Detection and alerts
- In Reports > Reports snapshot, click on ‘View all insights’ within the Insights panel.
Next, hit the blue ‘Create’ button in the top right corner to open the ‘Create Custom Insight’ window.
All available anomaly detection insights are pre-ticked. All you need to do next is to click ‘Create selected.’
You can review and edit the conditions and name for each instance, but the default settings are a pretty good start. You can come back later and refine them if you find them too sensitive.
Verify your data and plan your next steps
Now that you are tracking some basic data points in GA4, you need to verify the information. Firstly, you want to collect a reasonable amount of data before comparing how the new GA4 data set corresponds with the existing Universal Analytics data. The easiest way to do this is side-by-side in a Data Studio dashboard.
The two platforms use different data models so expect some differences! A good starting point to read up on those differences in Google's documentation on the subject.
While collecting data (2-3 weeks' worth of data is a good starting point for comparison), you should plan what additional data points you want to start tracking in GA4. Additional event tracking may require work to the dataLayer. Setting up eCommerce tracking certainly does. We, therefore, advise our clients to start with the 5-6 most essential user interactions (including conversions) and build the solution out from there.
Avoid simply copying your Universal Analytics configuration into GA4 - think big, be bold and re-invent how your organisation uses data.
Sam Dunkley, Senior Web Analyst
Now, at this stage, it's important to remember that GA4's event-based data model provides an opportunity to review your organisation's measurement strategy from the ground up. With a sound understanding of your organisation's data and reporting requirements, as well as some careful planning, what you do next can quite dramatically impact how your organisation uses data going forwards. The aim is to plan and adopt an event taxonomy that is logical, scalable and will stand the test of time.
We can help. If you would like some advice on migrating to Google Analytics 4, get in touch today.