
5 ways Google Data Studio can transform your analytics from the mundane to magnificent
By Intern |3 Aug 2017
Wading through the swamps of data within Google Analytics can be a confusing, overwhelming and time consuming process.
Where do you start? What are the metrics that matter? And how can you display them in an engaging but readable way? Not only for you, but for everyone across the business, including the board.
When all you want is a clear and concise performance overview of your digital activity, the last thing you want to be doing is wrestling with Excel downloads to compile graphs and charts from scratch.
And that’s where Google Data Studio comes in. A relatively new release from Google (made available to everyone from March this year), it’s the decorative icing on your data stack cake.
It sails in on a branded backdrop with bespoke fonts and colours to transform your data into creative, visual reports that everyone can understand.
This free, easy-to-use and flexible tool is a master of simplification when it comes to reporting. So let’s take a look at how to get started with it.
So what is Google Data Studio and why do I need it?
Google Data Studio is a free data visualisation tool that turns your raw data into fully customisable, always accessible, visual reports.
Gone are the days of grappling with the limited functionality of Google Analytics (GA) dashboards. No more downloading GA data to create graphs and charts from scratch. No more reminders to send reports each month to stakeholders and members of the business.
Instead you can build engaging reports and create live dashboards that update dynamically, are easy to understand, and always accessible and shareable with everyone at the click of a mouse.
In this blog we’ll show you how Google Data Studio can help your business:
- Create visually appealing dashboards and reports
- Avoid repetitive tasks when creating recurrent reports
- Ensure reporting is consistent
- Save time by creating templates that can be used as starting points for new reports (see our free Google Analytics Ecommerce template in point 3)
- Easily share reports with other users
- Keep data secure using the sharing options
Five reasons you should be using Google Data Studio
1) Create more engaging, branded reports
Let’s face it, reporting can sometimes be boring. Even if you (or your web analysts) aren’t visually creative, Google Data Studio injects a bit of life back into your analytics, and makes it easy to create striking visual reports.
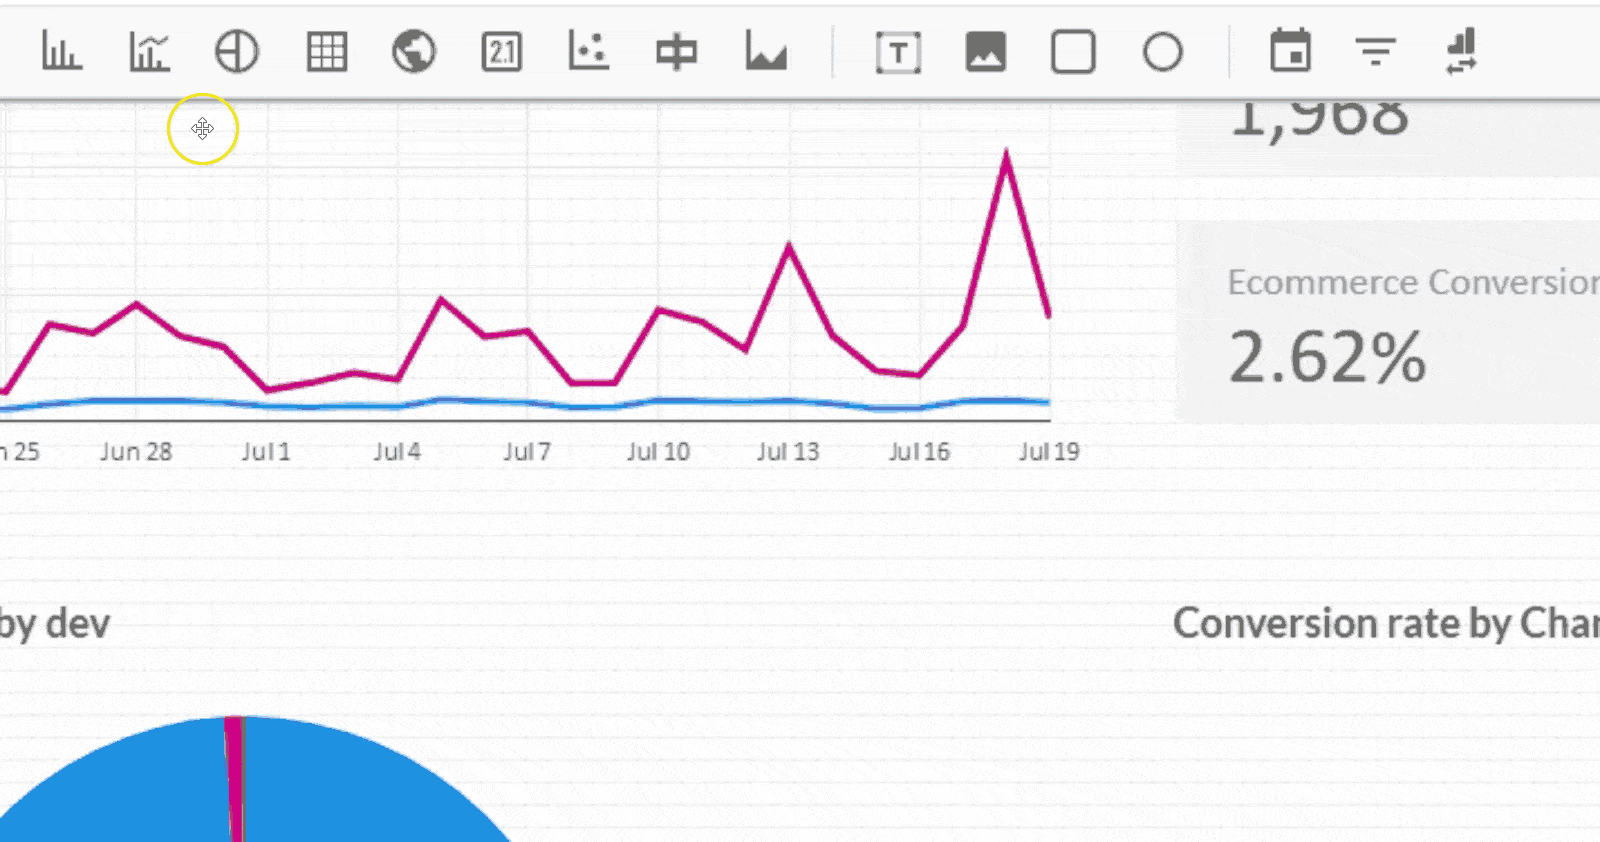
Once you’ve chosen the metrics that matter to your business, Data Studio will transform these into engaging, visual dashboards that anyone can view via a shareable link.
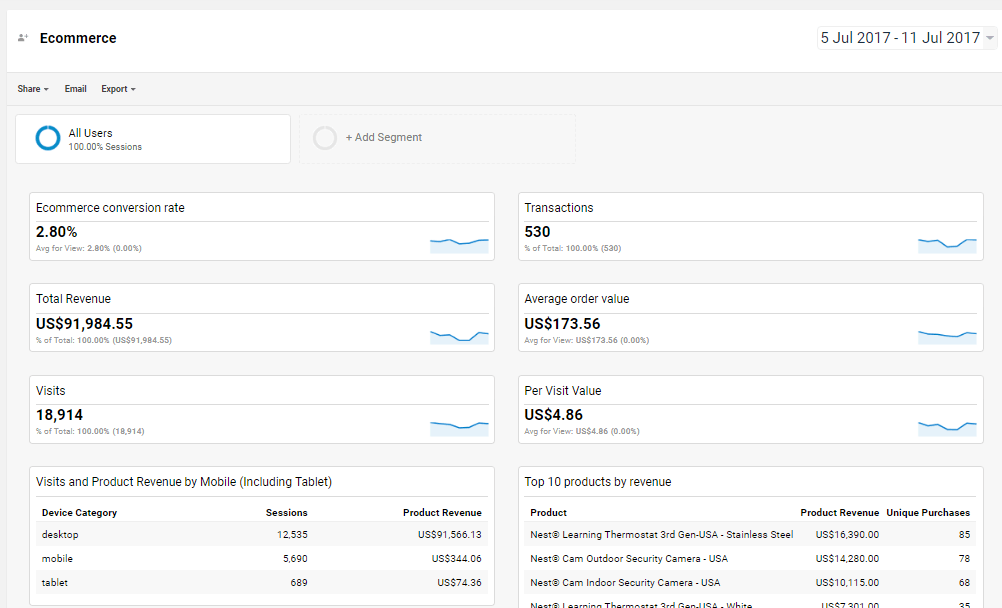
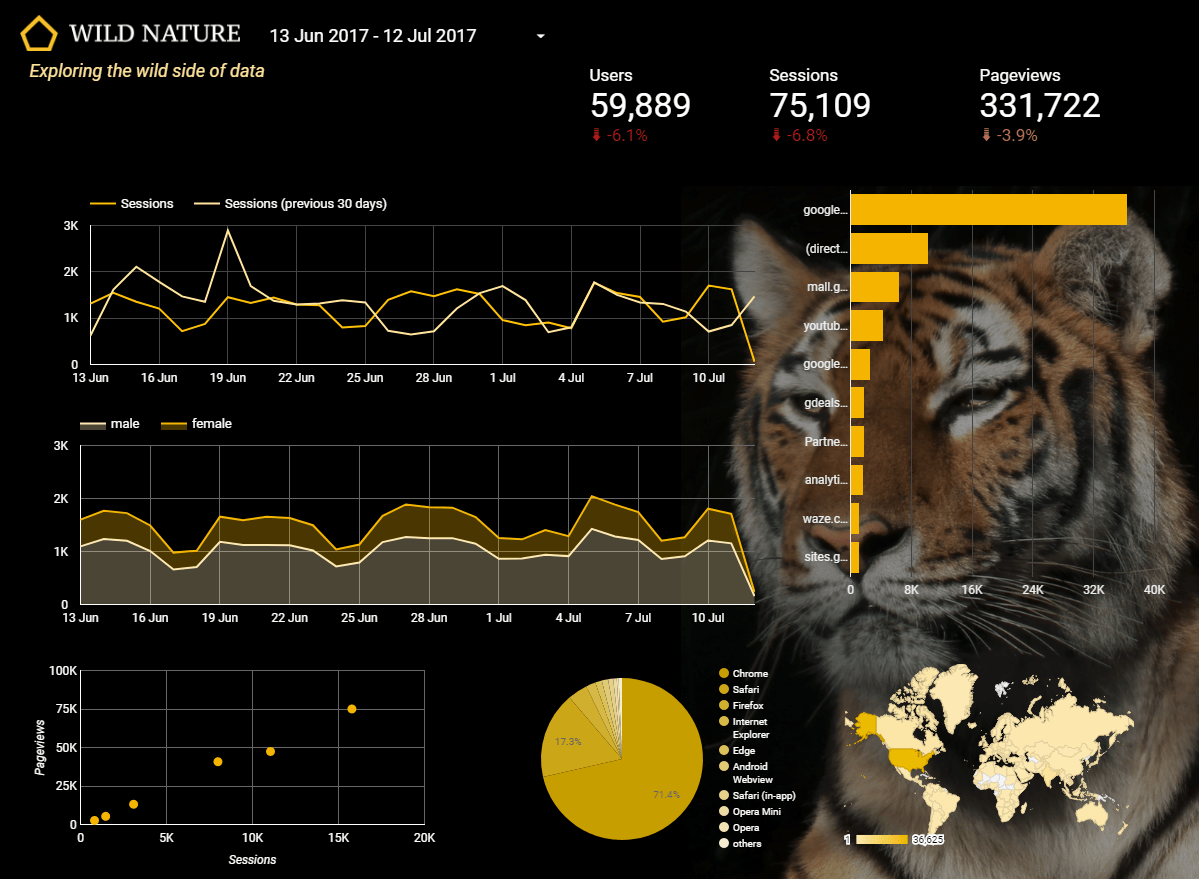
Below is a comparison of a custom dashboard created in GA vs a Google Data Studio report. We know which one we prefer…
Screenshot of GA dashboard:
Screenshot of GDS:
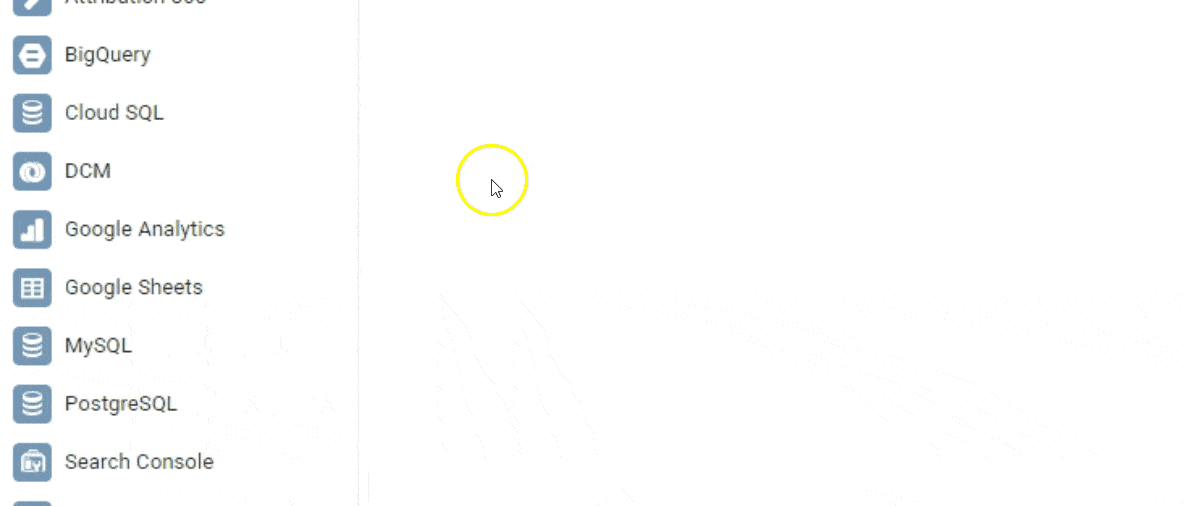
It’s not just Google Analytics that the platform integrates with either - you can also connect data from a host of sources including Google Sheets, BigQuery, AdWords and YouTube Analytics.
A single, consolidated view of your digital performance.
Simple.
2) Interactive and dynamic reporting
Nothing stays static in the digital world, and neither should your reporting. Google Data Studio reports are dynamic, so you can change the date range and drill down into segments to adjust your view.
Change the data source, and your report is updated in real time. This intuitive and user-friendly interface allows you to reuse reports and create templates specific to your requirements, all with a few clicks of your mouse.
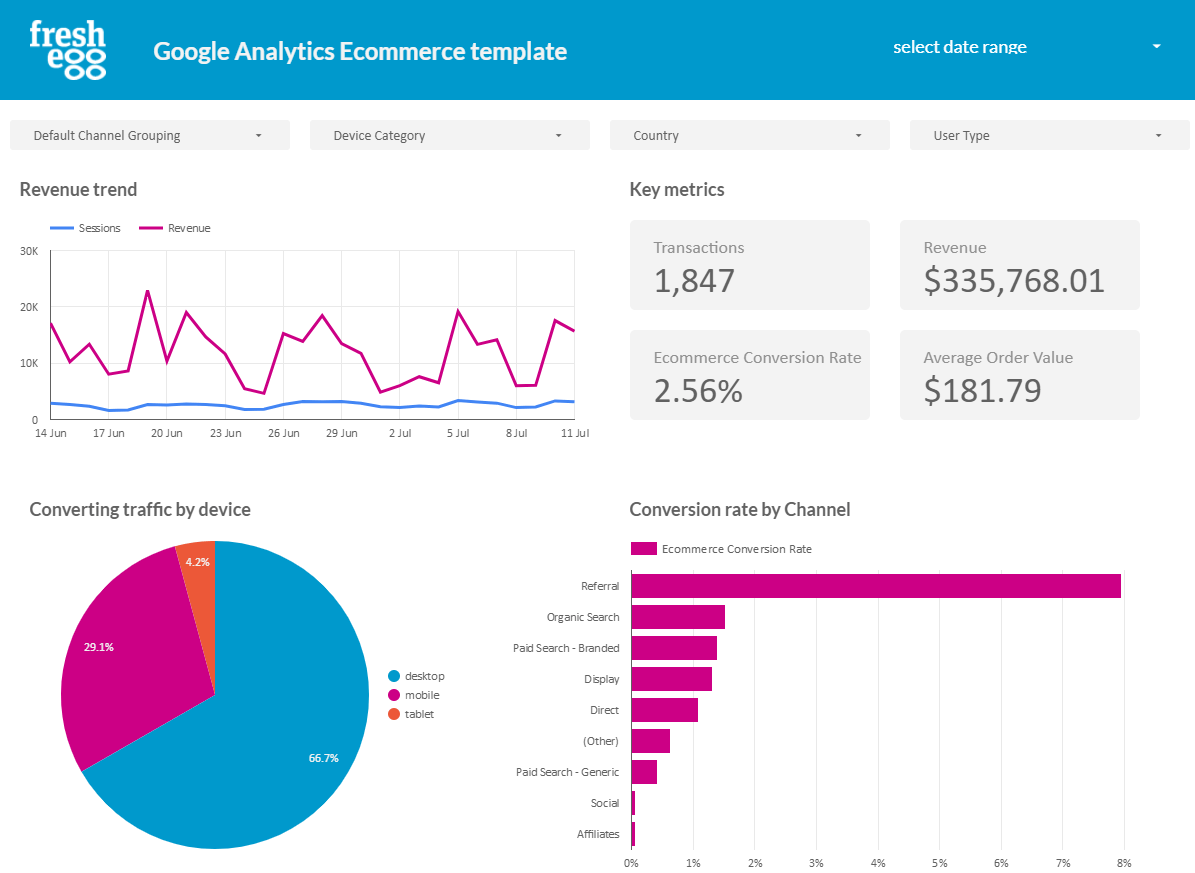
Download Fresh Egg’s free Ecommerce template for Google Data Studio
To use our free template, click the ‘Make a copy’ button and connect your own GA data source.
3) Put reports together quickly
Time is of the essence when reporting ROI, so it’s a good job Google Data Studio has efficiency at its core.
Creating your report is simple – you can hook your chosen metrics into a range of visualisations such as charts, tables, maps, text, images, etc – just choose your component from the editor and draw directly into the report.
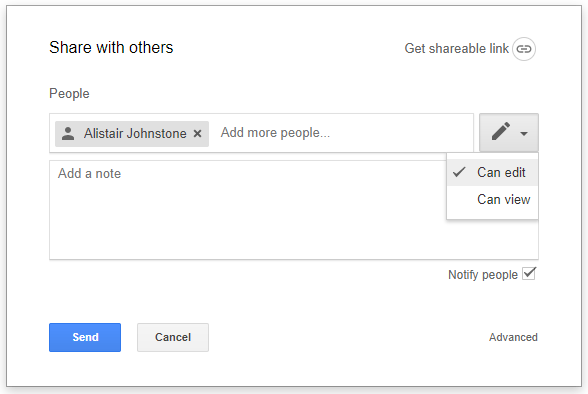
4) Share and collaborate
Just like with Google Docs and Sheets, Data Studio also offers collaborative editing, so your whole team can access and work together on reports with ease.
Sharing your reports is easy – just invite people by email and set their individual access rights to suit. Or, if you prefer, make the report publicly accessible on the web with no sign in.
5) It’s free!
They say the best things in life come for free, and this is no exception. There’s lots of paid for reporting software on the market right now but why pay when you’ve got Data Studio at your fingertips for free?
There’s no limit on the amount of reports you can create so you can really go to town.
If that’s your thing, of course. I mean, whatever floats your boat…
https://datastudio.google.com to get started.
Making it better: Our Google Data Studio Wishlist
Whilst Google Data Studio of course has everything you need to start making some great looking dynamic reports, but we think there are a few things that would make it even better.
1) Embeddable reports
We’re excited to hear that this is something Google are working on, but being able to embed reports on web pages would be a great feature that would provide yet another option for sharing your reports.
You could also create one-off graphs or charts to include in online blog posts or articles.
2) Totals in tables
Having the option to add a totals row to your table, in the same way we can view these in Google Analytics.
3) Scheduled emails
Although it’s great to not having to send reports out each month, the flipside is that your reports are in danger of being forgotten about! The option to schedule emails to remind users to check their Google Data Studio report could help prevent this from happening.
4) Ability to comment when collaborating like Google Docs
Although users can already collaborate within Google Data Studio, they can’t currently leave comments, which are a great way of communicating changes, directly within the document.
Are you using Google Data Studio yet? We’d love to hear, in the comments below, what you think of it and what you’re using it for!