Why is my organic traffic dropping? How to spot AI overviews in your own data
- Published
- 14 October 2026
- Read time
- 8 min read
Organic traffic falling, but your rankings look fine? AI Overviews may be answering your audience’s questions before they reach your site. Here’s how to check using the tools you already have, and how to measure success in a way that reflects how search works now.
 Tom Light
Organic traffic falling, but your rankings look fine? AI Overviews may be answering your audience’s questions before they reach your site. Here’s how to check using the tools you already have, and how to measure success in a way that reflects how search works now.
It’s one of the most common questions we hear from marketing teams right now. Organic sessions are down, sometimes sharply. But when you look at rankings, nothing much has moved. You’re still on page one, often still near the top.
There are plenty of possible causes for a traffic drop, and it’s worth ruling those out first. But if your rankings are holding and your clicks aren’t, there’s a good chance AI Overviews are part of the story. Google is answering the question on the results page, and fewer people need to click through.
You don’t need specialist tools to find out. In this guide, we’ll walk through what to rule out first, the pattern AI Overviews leave in your Search Console data, how to check it in Search Console and GA4, and the success metrics to report on instead. By the end, you should be able to tell whether AI Overviews are behind your traffic drop, and what to do about it.
For the bigger picture on why this is happening, read our guide to zero-click search in 2027.
1.First, rule out the usual suspects
Before you put a traffic drop down to AI, check the more familiar causes. Any of these can look like an AI Overview problem at first glance.
Possible cause | What to check |
|---|---|
Tracking changes | Has anything changed in your GA4 setup, consent banner or tags? A drop in sessions with no drop in Search Console clicks usually points here. |
Site migration or URL changes | Did the drop start after a redesign, a platform move or changed URLs? Check redirects and for pages that have fallen out of the index. |
Google updates | Does the timing line up with a core update? Look for lost positions, not just lost clicks. |
Seasonality | Compare with the same period last year, not the previous month. |
Technical issues | Check Search Console’s indexing and Core Web Vitals reports for new errors. |
Lost rankings | If average position has dropped, this is a ranking problem first. |
The last point is the important one. If your rankings have fallen, start there. If they’ve held steady and clicks have still dropped, read on.
It’s rarely just one cause. When we looked at falling guide traffic for an insurance client recently, most of the losses fitted the AI Overview pattern. But some didn’t: a handful of guides tied to a news story had dropped simply because people had stopped searching for it. Separate those out before you draw conclusions.
2.The AI Overview fingerprint
AI Overviews leave a recognisable pattern in your Search Console data. Your graphs might look something like this:
 The signs to look for:
Average position stays roughly the same. You haven’t lost rankings.
Impressions hold steady or rise. People are still searching, and Google is still showing your page.
Click-through rate falls. Fewer of those people click, because the answer is already on the results page.
Clicks fall as a result. This is the drop you noticed in the first place.
The drop is concentrated on informational searches, the what, how and why questions.
Blog posts and guides are hit hardest, while product and service pages usually hold up better, for now. Our own research found AI Overviews on more than nine in ten commercial searches in the UK, so don’t assume commercial pages are safe.
The timing lines up with AI Overview rollouts. In the UK, that’s from August 2024 onwards.
One or two of these signs on their own could have other explanations. When you see most of them together, AI Overviews are the most likely cause.
3.How to check in Google Search Console
Checking for the fingerprint takes about half an hour.
Compare year on year
Open the Performance report and go to Search results. Set the date range to compare the last three months with the same three months last year, and turn on all four metrics: clicks, impressions, CTR and average position. Comparing year on year removes most seasonal swings.
Isolate your question searches
Add a Query filter, choose Custom (regex), and paste in:
^(what|how|why|when|where|who|which|is|are|can|does|do|should)\b
This shows only searches that start with a question word, which are the ones most likely to trigger an AI Overview. Run the same comparison again and look at whether CTR has fallen while position held.
Compare page types
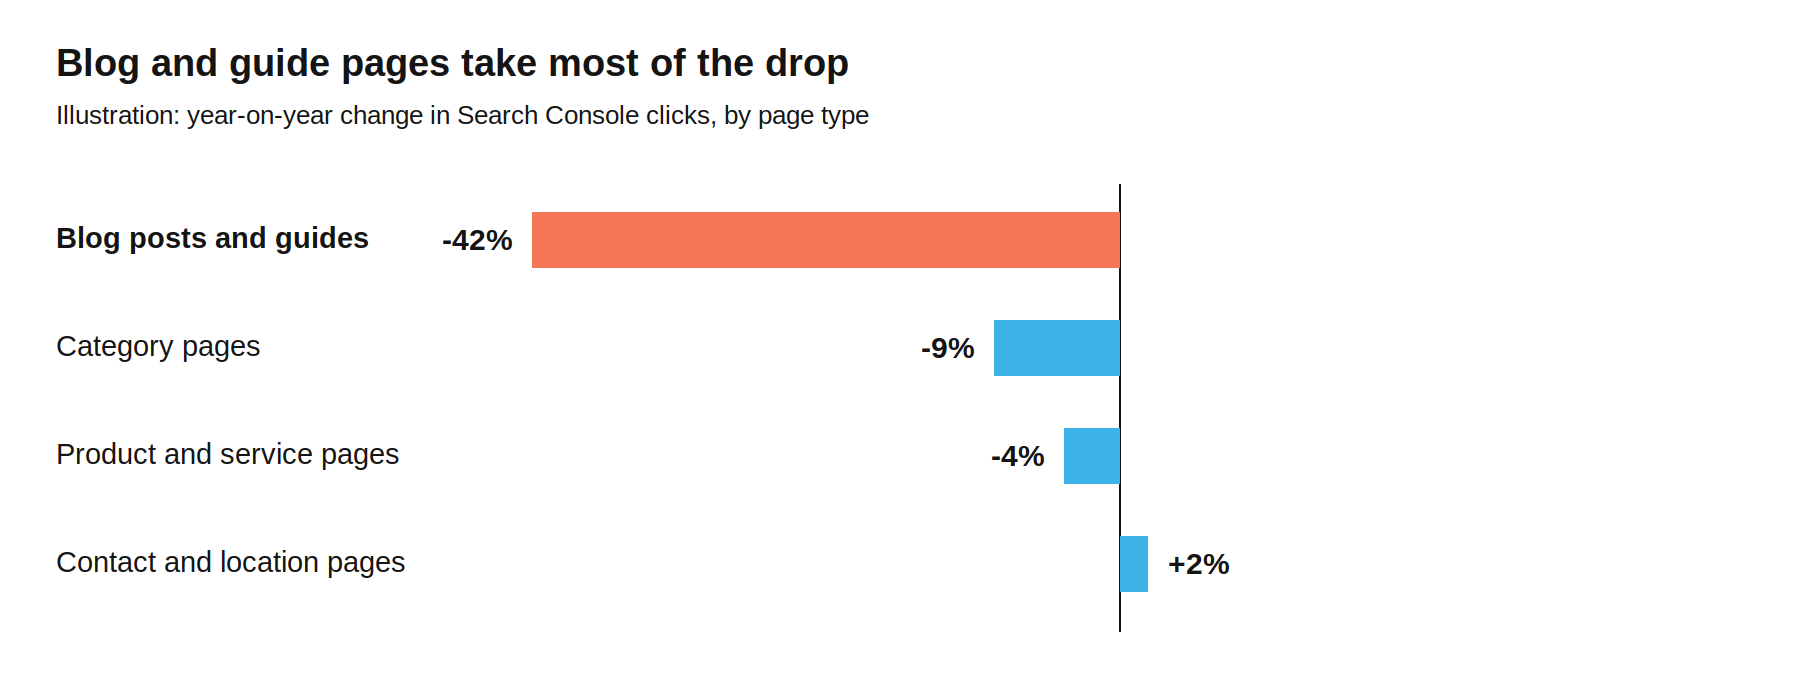
Add a Page filter for your blog or guides folder (for example, URLs containing /blog/), then repeat for your product or service pages. If AI Overviews are the cause, your informational pages will usually show a much bigger drop.
Find the biggest CTR drops
Export the query comparison and sort by the change in CTR. Focus on queries where position barely moved but CTR fell sharply. These are your strongest candidates.
Check the results page yourself
Search for your top 10 to 20 losing queries in a private browser window. Note whether an AI Overview appears, and whether your site is cited in it. It’s manual, but it’s the most direct confirmation you’ll get.
Search Console doesn’t tell you when an AI Overview appeared or whether you were cited in one. That’s why step 5 matters, and why you may want proper tracking later on.
4.Cross-check with GA4
Search Console tells you what happened before people reached your site. GA4 can tell you what those visits were like, and that helps confirm the story.
In GA4, open Reports, then Engagement, then Landing page. Filter to organic search traffic, and set the date range to the period before your clicks started to fall. Then look at the pages that lost the most clicks in Search Console.
Your data might look something like this:
Landing page (illustrative) | Engagement rate | Average engagement time | Key events per 100 sessions |
|---|---|---|---|
/blog/what-is-x | 31% | 0m 22s | 0.2 |
/blog/how-does-x-work | 34% | 0m 28s | 0.3 |
/guides/x-explained | 38% | 0m 35s | 0.4 |
/services/x | 64% | 1m 48s | 4.1 |
/pricing | 71% | 2m 05s | 6.3 |
If the pages that lost clicks had low engagement and very short visits, that’s a strong sign people were arriving, getting a quick answer and leaving. That’s exactly the kind of visit an AI Overview now replaces.
A note of caution: this is supporting evidence, not proof. Low engagement can have other causes, such as slow pages or a poor match between the search and the content. GA4 also measures engagement rate rather than the old bounce rate, so compare like with like if you’re looking back at older reports.
5.Not all lost traffic is equal
A falling traffic graph feels alarming, especially when it’s the number leadership looks at first. But before you treat it as a crisis, check what that traffic was actually worth.
If the clicks you’ve lost came from quick-answer visits, with low engagement, short visits and few key events, then many of those visitors were never going to become customers. They got their answer and left. Now they get it from Google instead.
That’s exactly what we found with the same insurance client. Clicks to their guides were down by around a quarter year on year, and most of the loss came from quick-answer guides. In the same period, organic revenue was still growing. The guides that support buying decisions, on cost and risk, kept a click-through rate roughly double the quick-answer ones, and it held steady. The traffic that went away was mostly traffic that was never going to buy.
Two questions help put the drop in context:
What did these pages contribute? Check key events and conversions from the affected pages before the drop. If they were low, you’ve lost volume more than value.
Are your commercial pages holding up? If product, service and pricing pages are steady, the part of search that drives revenue is still working.
That doesn’t mean the lost traffic doesn’t matter at all. Those quick-answer visits were often someone’s first contact with your brand. The goal now is to make sure your brand is still part of that first moment, even when no one clicks. That’s where your success metrics need to change.
When someone tells me their traffic is down, the first thing I ask is what that traffic was doing for them. Quite often, the honest answer is not much. The pages losing clicks were answering quick questions, and the pages that drive revenue are still working.
6.Setting new success metrics
If you only report on clicks and sessions, you’ll keep reporting a decline, even when your content is doing its job. The answer isn’t to stop measuring traffic. It’s to measure the things traffic can no longer show on its own.
 What each new metric tells you:
AI citations and share of voice: how often your brand appears in AI Overviews and AI answers for the questions that matter, and how that compares with competitors.
Impressions: how often Google shows your pages, which is a measure of visibility even when nobody clicks.
Branded search growth: whether more people are looking for you by name. This is one of the clearest signs that zero-click visibility is building awareness.
Conversion rate of organic clicks: the clicks that remain tend to come from people further along, so they should convert better.
Assisted conversions: whether informational content plays a part earlier in journeys that convert later.
The key is agreeing these measures upfront, so a fall in informational traffic is read in context rather than as a failure.
7.How to track AI Overviews
Once you know AI Overviews are affecting your traffic, you’ll want to track them over time. There are three levels, and you can start with the first today.
Approach | How it works | Good for | Limits |
|---|---|---|---|
Manual checks | Search your priority queries in a private window each month and log whether an AI Overview appears and whether you’re cited | Getting started, small sites, confirming what the data suggests | Time-consuming, and results vary by location and session |
SEO tools | Use SERP feature filters in tools such as Semrush or Ahrefs to see which of your keywords show an AI Overview | Seeing the scale across your whole keyword set | Shows whether an AI Overview appears, but not always whether you’re cited or what it says |
AI visibility tools | Prompt tracking tools run your customers’ questions through Google AI Overviews, AI Mode, ChatGPT, Gemini and others on a schedule | Citations, share of voice against competitors, and tracking more than one AI platform | Paid, and needs a well-chosen set of prompts to be useful |
Most businesses benefit from a mix: an SEO tool for the big picture, and prompt tracking for the questions that matter most commercially. Google AI Overviews are only part of the picture. Your audience is also asking ChatGPT, Gemini and Perplexity, and each one gives different answers. We explain why in why you need to track more than one AI model.
8.What next
If your organic traffic is dropping but your rankings are holding, here’s the short version:
Rule out the usual suspects first: tracking, migrations, updates, seasonality and lost rankings.
Look for the fingerprint in Search Console: steady position, steady or rising impressions, falling CTR, mostly on informational pages.
Confirm it by checking the results pages yourself and looking at engagement in GA4.
Change what you measure, adding visibility and value alongside clicks.
Fewer clicks doesn’t have to mean less success. It means your reporting needs to catch up with how search works now. For what to do with your content next, read zero-click search in 2027: what it means for your content strategy.
If you’d like a second opinion on what’s happening to your traffic, talk to us. Our GEO discovery shows how AI engines currently see your brand, where competitors appear instead and what to do next. To see where you sit on the wider journey, read AI search maturity: where brands are now, and how to move up.
Find out what’s really happening to your traffic
Our GEO discovery shows where AI is answering for you, where competitors appear instead, and how to measure what’s working.