
How To Use The New Session Quality Score in Google Analytics

By Julian Erbsloeh|30 Mar 2017
Google continues to work tirelessly on improving Google Analytics: 2017 will undoubtedly bring exciting changes. Following the full rollout of the new user interface earlier this year, the focus has now turned to new reporting features. Last week a new report has appeared – Session Quality (Beta).
Sessions are assigned a session quality score between 1-100 to give an estimate of your users’ proximity to conversion (or propensity to convert). A high session quality score indicates deep engagement, while low scores indicate shallow engagements. If your website processes at least 1,000 ecommerce transactions per month, chances are you have this report available.
You can find it in Audience > Behaviour > Session Quality:
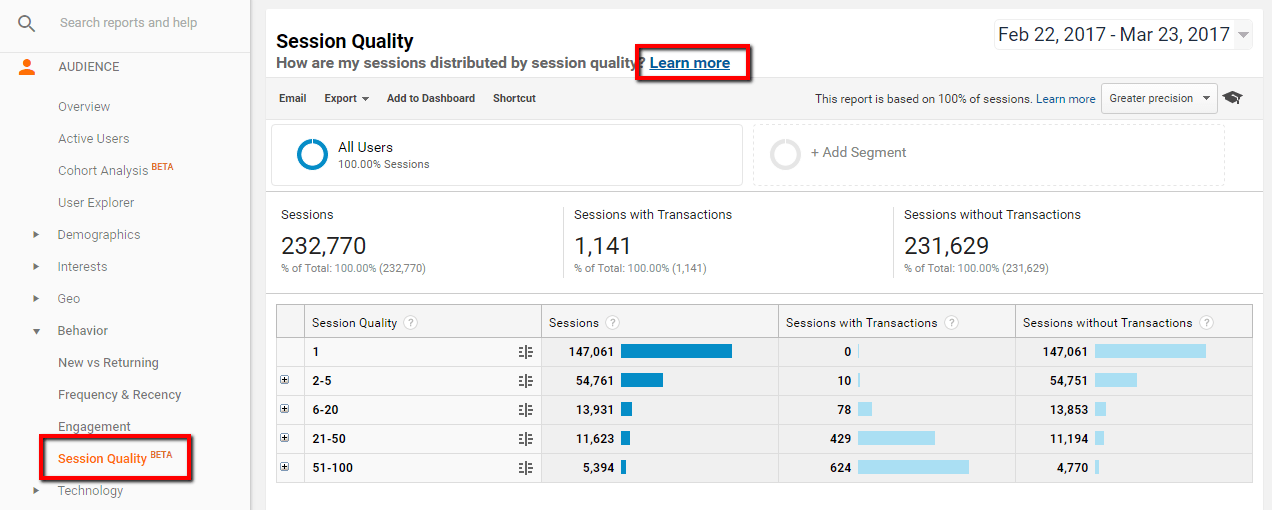
Here’s what Google say about how Quality Score is calculated:
Using similar machine learning as with Smart Lists and Smart Goals, Analytics calculates the Session Quality and Average Session Quality metrics to estimate a user’s proximity to conversion. User engagement is evaluated for each session, and the resulting proximity to conversion is expressed as a score of 1-100 for each session during the date range, with 1 being the farthest from and 100 being the closest to a transaction. A value of 0 indicates that the metric is not calculated for the selected time range.
If you want to learn more about how this works, the ‘Learn more’ link at the top of the page takes you to the Google Support pages with all the details.
“How should I use this?” I hear you say; well, there are a few options that immediately can provide value to your analytics.
Segmentation
In its most basic form, the quality scores allows you to understand what percentage of your users are high or low quality. This is a big step forward. Previously we have only been able to segment by converting and non-converting segments. It enables us to separate highly engaged, non-converting users from un-engaged users visiting a site.
Creating these segments is very simple. Click the icon next to the session quality score, decide where you want to be able to see this segment and save it:
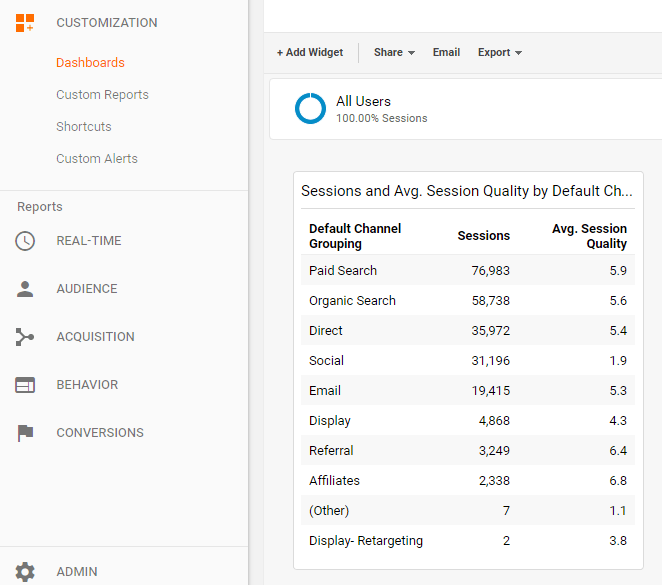
Creating user segments for higher quality sessions and identifying higer quality users will provide you a new level of understanding of your performance and campaign success. It enables you to answer which channels and campaigns are sending more engaged users to your site, where are they landing and what content are they engaging with.
Creating segments for low session quality can give a clear comparison. For example, the keywords driving low quality sessions against those that drive high quality sessions can then inform your bidding strategies accordingly.
Identifying bot traffic
Non-human traffic is an issue we are all aware of. And despite ticking the ‘exclude traffic from all known bots’ box in your settings, most of us will have seen suspicious activity in our accounts and have had to isolate and then exclude traffic from dubious networks and sources. To learn more on this, I have already written a blog post about our process of identifying and eliminating bot traffic a while back. Applying a ‘Session Quality equals 1’ segment to all your traffic is a fantastic shortcut to help with this.
Remarketing
Now, this is where things get really exciting. Using quality scores when building your remarketing audiences in Google Analytics should automatically improve their success rates by excluding users who have been less engaged. Therefore, an increased conversion rate will allow you to increase your bids for this smaller audience with confidence.
There are quite a few things in the pipeline for this year so we will make sure we keep you updated whenever a new features available.
Have you been using Quality Score? Tell us, in the comments, how you have been using it and whether or not you think this new report and functionality is useful!