
How marketers can use Google Search Console to improve performance in organic search
Google has spent time developing features on its free-to-use Search Console. We provide guidance on how best to use the available information.


Although some functions may change (and some 'legacy' tools currently seem to be broken), the following methods will provide valuable data for marketers when assessing website performance and provide opportunities to improve organic performance.
"For a long time, Webmaster Tools was a bit of a joke - a sort of technical interface that didn't give much insight into a domain and (in reality) just gave you the option of adding an XML sitemap. But now, it's become essential to monitoring and diagnosing problems with search visibility and tapping into organic search intent to inform marketing efforts. When used correctly, it is also an important tool to feed into your strategic planning for a website."


Stephen Jones, SEO Director
In this guide, I will share a number of aspects that will help you with learning what is working for you, including:
- How do I know if there are problems with my website?
- How do I know if my website pages are in the search index?
- How do I know what people are searching for?
- How do I identify top/poor performing pages?
- What impact does schema have on organic performance?
- How do I identify problems with mobile performance?
- What are Core Web Vitals, and what should I check?
How do I know if there are problems with my website?
First off, ensure you have a Google Search Console account set up and authorised. Here's a guide on how to do this. Remember - the type of profile you use may determine which features are available to use (the interface will let you know).
Search Console acts as a message interface between Google and the authorised owners on the GSC profile. The little message bell at the top of the screen will let you know if there's a message to read.

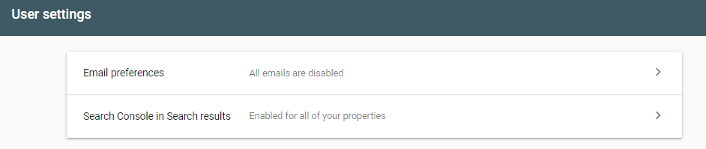
Usually, these will be monthly summaries of site performance. You can opt for email messaging if you click on the person/cog icon directly to the left. This action ensures you get 'pinged' when there's a new message (or not, depending on your preferences):
However, this will also include things that Google notices on the account too, such as:
- Sudden increase or decrease in activity (indicating a surge of popularity or potential issue)
- Switching to mobile-first indexing (if it wasn't already)
- Suspicious linking activity
- Breaches of webmaster guidelines (such as cloaked content or spammy rich snippet use)
- Suspicion of hacking or malware on the domain
Issues can happen with site activity (accidental or otherwise) that violate Google's guidelines. If an alert appears in Search Console, there's a chance an algorithm has spotted something, but also the possibility a spam reviewer has manually checked the site and found problems.
Events outside your control, such as malware or hacking, may also trigger messages. Any alert indicating Google has a problem with the quality of the website must be dealt with urgently. Google will usually provide some indication of what the problem is and where. There will also be a link to a reconsideration request so you can notify them to re-evaluate the site when it's fixed. Failing to address the problems will usually negatively impact organic visibility shortly after receiving the alert.
How do I know if my site pages are in the search index?
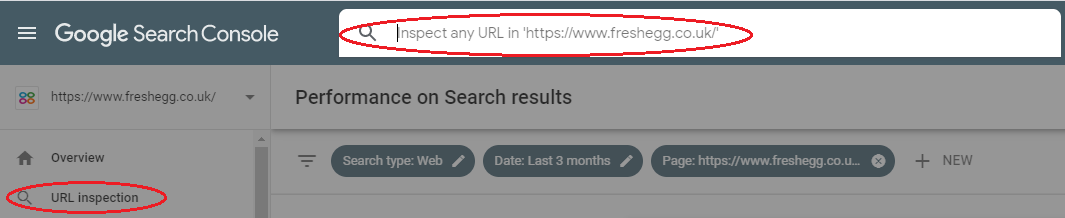
There's a couple of tactics here. You can search for individual URLs using the 'URL inspection tool'. Type or copy the full URL (including the 'http://' or 'https://') into the search box:
This action will check if the page is in the index and provide expandable sections with more information.
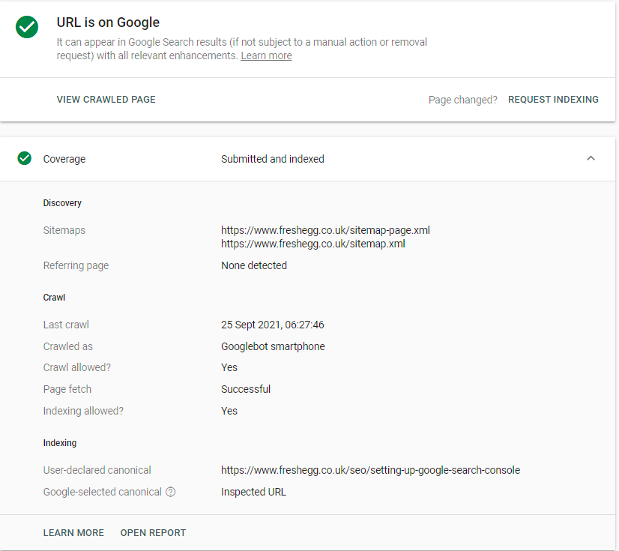
- If the page isn't in the index, the report may tell you why (perhaps it doesn't have the correct status code, or Google has picked a similar page as a canonical version)
- You can use a test button to check if Googlebot can crawl and index the page. This feature helps if some work has occurred since Google last tried to access the URL to fix it.
- If there's no issue preventing Google from indexing the page, you can request it to be indexed using the 'request indexing' button. Note that this function sometimes limits the number of pages you can request per day or is sometimes temporarily disabled if Google is experiencing resource issues with the crawler.
So that's quite useful if you are checking on specific URLs (e.g. key landing pages), but what about the site overall? To assess this, you need the "Coverage" section on the left-hand menu.
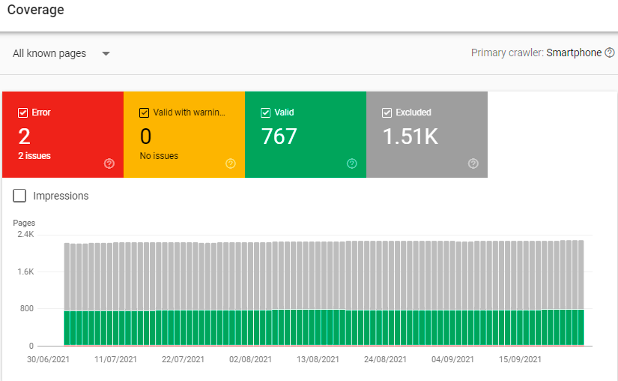
The coverage report allows you to select different types of pages. It will display a sample URL of up to 1,000 URLs of those pages in the detail section below. There is generally a few days lag, and data isn't real-time (so don't be surprised if a URL marked as 'error' is actually 'valid' when you check it).
- Error pages: provide 'not found' or 'server error' codes. Many errors aren't ideal for customer experience but generally don't cause issues for SEO unless popular pages with lots of traffic and backlinks are broken for some reason. Significant increases in server errors (5xx status codes) might indicate performance issues with the site host or domain server.
- Valid with warning: these are pages that are in the index but have issues for Google. Often, these are 'soft 404' pages: URLs that provide a live '200' status code but don't have any content. Google will make its mind up about these, but it's a good idea to tidy up any pages that could be blocked or solve issues that might stop valid pages from being included.
- Valid pages: are the ones in the index. This count should reflect the live pages on the website and the results of a 'site: yourdomain' search in Google.
- If it's higher than you expect, rogue URLs are being crawled and bloating the index.
- If it's lower than you expect, Googlebot may be having some problems crawling and processing your site pages.
- Excluded pages: This is a helpful section. Here you can see where Google is ignoring certain types of URLs.
Some of these may be in a processing backlog; Googlebot has crawled them, but they're not in the index yet. Either it's still deciding how to handle them, or it has to crawl so many pages on the site there's a backlog it needs to work through. This might stop new or updated pages from being indexed and ranked until they are processed. Having a high backlog might show Googlebot is accessing lots of unnecessary pages and must decide whether to index these or not.
Intentional exclusion of some pages: you will have used a 'noindex' or canonical tag to another URL on them. This action is fine, but when done at scale, it can waste resources. Googlebot must first crawl the URL before deciding if it's going to obey the directive.
Googlebot has a certain number of URLs it crawls on each visit (the 'crawl budget'). If you have the right profile, you can get an idea of how much that is by going to the 'settings' cog on the bottom left menu and opening the 'crawl stats' report:
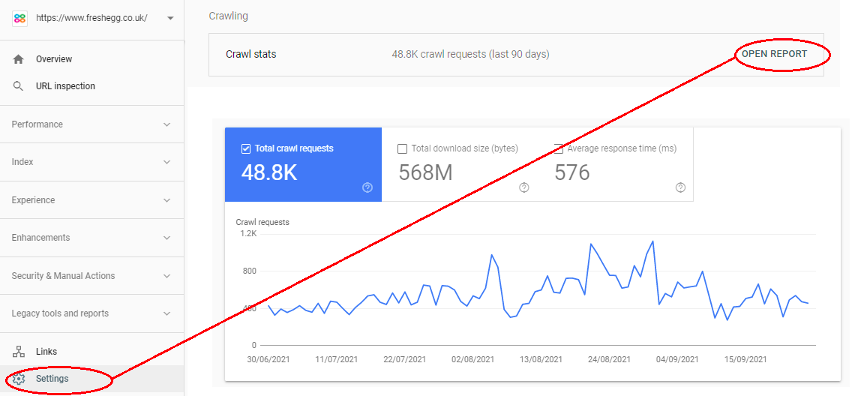
This output gives you data for the last 90-day rolling period. So, dividing the 'crawl requests' by 90 provides you with an estimate of how many URLs Googlebot crawls each day.
💡Pro tip
Google Search Console provides you data for the last 90-day rolling period. So, dividing the 'crawl requests' by 90 provides you with an estimate of how many URLs Googlebot crawls each day.
- The crawl rate will go up and down: it will depend if Googlebot thinks it needs to discover more content on your site or not. Don't try to inflate the crawl rate artificially - Google doesn't like it.
- Googlebot will prioritise some pages over others: Top-level pages are most likely to be crawled on each visit. Deeper content may not be if the daily crawl budget is less than the number of valid pages plus 'excluded' pages Googlebot is processing. The crawler may have to make repeat visits to 'see' all the content on site.
You can get a general idea if the number of excluded pages is due to 'noindex', canonical tags or redirects eating up a lot of crawl budget. Ideally, you want Googlebot crawling your live pages as often as possible. The crawl frequency keeps the page cache recent, and the results will be seen as 'fresh' when Google ranks content for search queries.
If a page had only been crawled one or two weeks ago, competing content published from other sites during that period and might push older, 'stale' content further down in results.
So, it's a good idea to see if lots of resource processing is wasted in the 'excluded' section on URLs that don't require inclusion in the index.
Usual culprits include:
- Not updating site links after content has been moved or changed URL. If an old link is on a navigation menu, it can generate redirect errors across every page on the website.
- Using canonical or noindex tags to mop-up wide scale content duplication. There are usually more efficient ways of doing this that won't burn through precious crawl budget.
- URLs with dynamic parameters accessible to the index, and Googlebot must decide what to do with them. Again, blocking these pages can happen without any negative SEO impact.
If you can identify patterns of URLs that don't require crawling, you can exclude these by using 'disallow' parameters in the robots.txt file. Just be sure to check your exclusion logic to ensure you don't block unintended pages.
💡Pro tip
Saving days (or weeks) of wasted crawl budget can sometimes result in significantly better organic performance for the website.
How do I know what people are searching for?
One of the unique advantages of using Search Console data is that it still provides a sample of organic query data hidden and encrypted in Google Analytics. It provides a rolling 'window' of data and a sample maximum of 1,000 rows, but you can connect the GSC data connector in Google Data Studio and pull more data if you need to.
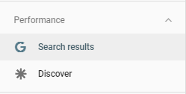
Use the 'Performance' link on the left-hand menu to access the data. Search Console may list 'Discover' and 'Google News' data if the content from your site appears in these services.
Google News shows content that's appeared on news.google.com or the mobile news app.
In Discover, users receive content suggestions in mobile search results based on their search habits.
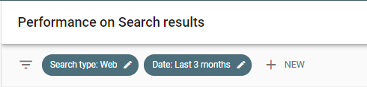
Otherwise, you will want the 'Search Results' link:
To make this data meaningful, it helps to filter down to specifics. The default option looks at web results in the last three months, but you can apply extra filters to narrow this down. Just click on an existing filter to edit or the 'new' link to add another dimension.
The date option will give you the chance to look at fixed periods within the last 16 months. You can also compare dates (helpful in looking for impacts of a site change) but remember this is a rolling period. Unless you store this data somewhere, it will disappear when new data becomes available, and the furthest back you can look is 16 months.
If you have a small or new site with little traffic, you probably need to set the date filter quite wide. A larger website with more traffic can look at more recent data and still exceed the sample size.
- Country will let you look at specific countries. Google will usually aggregate all country data, so unless you have a multinational site, you can filter this to your target market(s)
- Pages let you specify certain sections or URLs of the site. Bear in mind that without specifying a landing page and query, the 'average position' metric is misleading
- Queries let you specify certain types of searches. This function is excellent for isolating or eliminating brand queries
- Brand queries generally perform better. A brand query uses your brand name, website address or combination of that with a product or service (e.g. "Acme.com" or "Acme roadrunner explosives"). If Google is aware of your company, it will realise brand queries are trying to locate your website and try and return a relevant page at the top of results. Higher results will generally have a much better clickthrough.
Lack of brand queries can signal a general lack of brand awareness, market share, or competition with another brand or phrase for which Google has a stronger search association. Competitors may also be pushing down your organic brand results by using paid search on your brand terms.
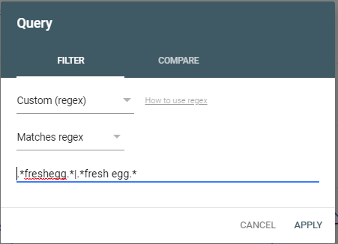
Non-brand will generally cover the main products or services the site provides. Unless you have a global mega-brand, these usually have larger potential volume but are more competitive – so position and clickthrough tend to be lower. Previously, the filters for pages and queries only let you specify a single parameter; a bit of an issue if you had multiple page groups or your brand covered two or more specific terms (not to mention common user misspellings). But now, Search Console has a regex filter option, so you can enter an expression covering multiple permutations and use the drop-down to match or exclude it.
Don't worry if you are not comfortable with RegEx; help is available. Use this RegEx builder in Google Sheets and copy the formula into the box in Search Console.
The detailed results will show you the type of searches used for the specified page(s), dates, country, etc.
- High impression terms: popular queries with prospective volume where the site appeared in search results.
- High click terms: they are prominent in search results and clicked on by users; usually, because they are in a good position.
- Clusters of particular searches can sometimes emerge: e.g. people looking for things nearby (in specific places or 'near me'), or evaluations ('best', 'cheapest', 'fastest' etc.). This information can give you important clues as to what content you need or if the content on pages you don't want to appear for those queries is monopolising and stealing traffic from other pages.
How do I identify top/poor performing pages?
You can click on the CTR and average position filters to enable these in the graph and populate the columns in detail below.
You will need to specify a particular page. Otherwise, 'average position' will be calculated across all site pages, including the homepage (which probably has a good average position) and much deeper pages which could rank anywhere.
You will also need to specify a particular query. Otherwise, 'average position' will be calculated from potential brand variations (with good visibility) and longer tail queries with a much lower average. Without these specifics, average ranking is a rather vague stat.
CTR is a calculation of clicks divided by impressions. A high CTR indicates good interaction with the page. Either it answers a specific topic, or it has a high average position and is in a place people tend to click a lot.
Low CTR might indicate a low average position (too deep in SERPs). If it does have good visibility, the SERPs appearance of that URL for that query is not helpful or tempting enough for people to click the result.
By looking at impressions, clicks, CTR and average position, you can start to see:
- Pages that have high potential (impressions) that are doing well with clicks and CTR
- Pages that have high potential (impressions) that are underperforming with interaction (low clicks/CTR)
- Pages that are positioned well for queries
- Pages that are on the 'threshold' for queries, i.e. position #11-12, just outside page one of SERPs, or positions #4-5, just outside the top three organic positions
Pages with good performance require safeguarding; so, if the content changes, it's worth checking that these won't impact pages that drive results.
Pages that don't have much interaction and low CTR might need revisions to the page title and meta description to encourage more people to click through or the addition of schema to appear as 'rich snippets'.
Pages with high potential but aren't performing well may also have content issues; do they thoroughly answer the search needs for that query? What kind of content do competitor pages that outrank you organically have? Do you need to up your content game to compete? Pages on the threshold might need a little nudge in terms of copy or internal linking to do a bit better to gain and visibility and achieve even more traffic.
Using the date filter to compare date periods (say last month compared to the previous period) also allows you to see page and query performance. Search Console now gives you a 'difference' column between the dates that you can click to sort the results, meaning that you can see the results that gained or lost the most impressions and clicks between the comparison dates.
So, for example, if I take a popular blog article, exclude brand queries and compare the last three months against the previous period, I see an uptick in queries that involve the term 'mg111':
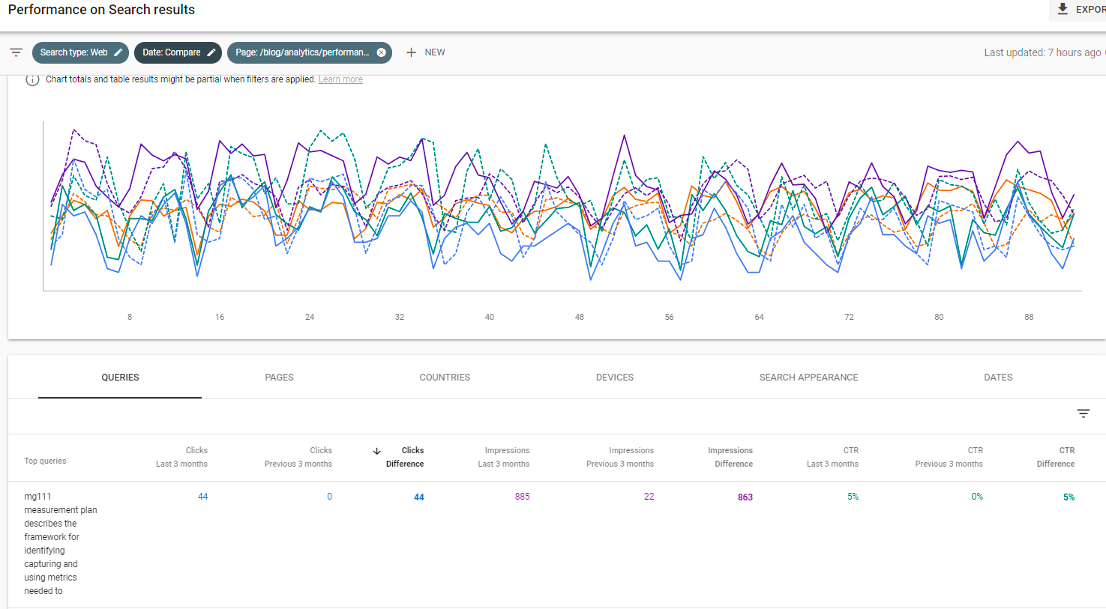
The top term – highly specific and longtail – is detailed here, and also clusters of similar terms show clicks and impressions.
A little deeper drilling shows this is mainly traffic from India, and the queries suggest it might be part of some online course about measurement plans that have referenced this page and the template.
The page itself doesn't mention 'mg111' anywhere... could we be cheeky and include it somewhere, either in the page copy or meta-information, to capture more traffic? Average CTR and position is good, but could it be pushed even higher? What additional business would this potentially drive?
This sort of analysis on pages that do well (or are not doing so well) can help create some content hypotheses to test out and see if they make a positive difference.
What impact does schema have on my organic performance?
Schema, or structured data, is a way of tagging information so that Google understands what it is. For example, you can tag information on an event so that Google will know when and where it is, how much tickets cost, who is performing, etc.
The addition of the schema allows Google to return more valuable results, so if I'm searching for 'The Tiger Lillies', Google will often show me when and where their next gig is happening.
Google supports several schemas and will display enhanced features in search results ("rich snippets"). These results have a slightly different appearance from others and often appear high on the page or even above the first organic results, and they frequently have better clickthrough. Google likely understands all sorts of schema and structured data, as this helps it understand what text means and provides better results for people. There are lots of different schemas that allow users to tag detailed information on their sites. For example, if you sell cars, a car schema can tag fields such as engine size, transmission type, number of doors, etc. If a customer was using those items in their search ("5 door automatic"), your page with the schema has a better chance of being seen as more relevant and ranking better for that query.
However, Search Console only tracks the structured data currently supported with rich snippets. At the time of writing, this includes:
- Products
- Events
- Job listings
- FAQs
- Articles
- Breadcrumbs
- Videos
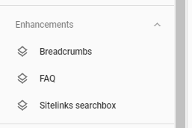
Search Console will track the valid schema it sees on the site in the 'enhancements' menu on the left:
This feature will tell you if the pages have the correct schema or validation issues exist. If there is valid schema, you can track the performance of this using the 'search appearance' filter in the performance section:
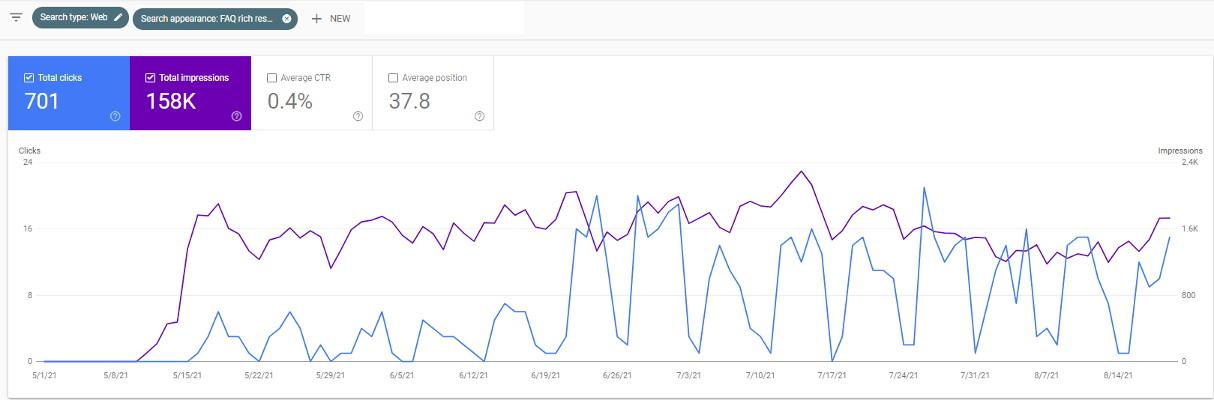
Here is an example of adding FAQ schema onto pages. At first, it starts generating impressions (showing up in results) but not too many clicks. But soon, the impressions generate click traffic which otherwise the site would not have received. Warning: You should check that rich results align with your marketing objectives.
The downside of displaying more detail in search results is that users sometimes get what they need from SERPs and don't need to click through to the website for more detail. In some cases, sites have removed FAQ schema as it was costing them traffic! However, if you are a smaller brand, it may be more relevant to gain visibility and expose the brand through these results (or you can get both visibility and clicks, which is ideal).
If you are undecided about the effort and impact of adding schema, Search Console can help you track its implementation and performance. Does it drive clicks? Is CTR higher on pages that have schema compared to those that don't? What brand/non-brand queries are these capturing? Remember, you can use your filter RegEx in this section too.
This analysis can help you determine if it's worth the time investment to include on other pages on the site.
How do I identify problems with mobile performance?
Google has a 'mobile first' mindset. If the content isn't accessible or indexable on a mobile device, your site will not rank for that content in search. The Googlebot Mobile user agent now indexes most sites.
Certain kinds of sites, particularly eCommerce sites, usually get a lot of traffic from mobile devices – often, most of their visits are on mobile.
So, it's vital to check the site is providing an excellent mobile experience to customers.
There are three ways to check:
Performance report
Firstly, the performance report allows you to specify a device type. This view can isolate traffic, but the option also gives you a tab where you can directly compare two different device types in the results screen:
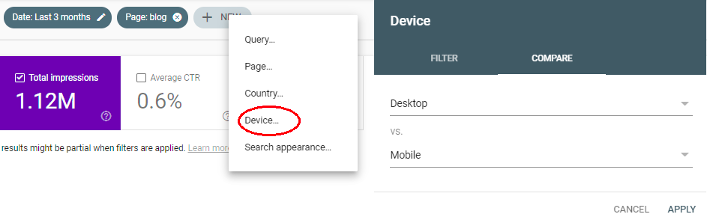
- You can see what device type gets more impressions and traffic and which has the higher clickthrough.
- Specifying pages and queries in the filter will give you an idea of better-positioned content on different devices.
Mobile usability test
Secondly, Search Console has an interface to check if pages pass its mobile usability test:
The new 'page experience' report also reflects this view. It will let you know how many URLs detected have issues that cause problems on mobile devices.
Unfortunately, if problems are widespread, it won't give you a list of all the pages affected. It will provide an example URL and a small list of 'similar URLs' that suffer the same problem. However, as issues are probably template-related, fixing the issue for one URL will likely fix it for all.
As mentioned before, the interface isn't real-time. It's worth double-checking URLs using Google's mobile-friendly test tool, as getting conflicting results is possible. It's probably best to go with the live results from the testing tool if there's a difference.
Core Web Vitals
Lastly, nestled in the experience report is the Core Web Vitals section. This section provides information on the performance of the pages for desktop and mobile.
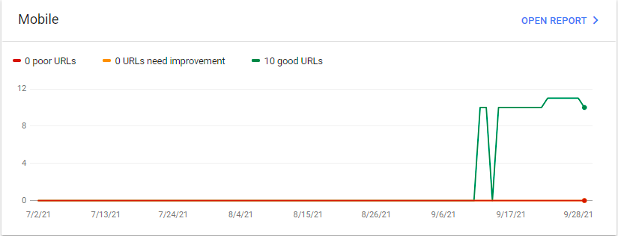
Note that Googlebot needs to run enough data on the site to make comparisons against the rest of the web. If the website is new or doesn't get a large amount of traffic like the one above, assembling the page information on all the URLs might take some time.
What are Core Web Vitals, and what should I check?
Core Web Vitals are benchmarks that Google is using to measure page performance. These page experience signals have played a part in rankings since May 2021 (as a tie-breaker, not a major factor). Still, it's also common sense that pages that are slow to load on mobile devices or have content that jumps around and provide a poor UX are a terrible experience and off-putting for users.
Core Web Vitals comprise three metrics:
LCP – Largest Contentful Paint
This measurement is how long it takes to download and display elements for the page. Mobile pages with a responsive layout often suffer from loading desktop-sized images for banners and carousels that the mobile display doesn't use (or have to be re-sized).
FID – First Input Delay
This metric records how long it takes the page to become interactive so users can begin using it. Loading lots of scripts, especially third party ones from slower servers, can interfere with users being able to interact with a page.
CLS – Cumulative Layout Shift
CLS refers to the stability of the page as it loads. The CLS score will be high if content shifts around and reflows on a page as it loads. A high score is counted as a bad experience, as content and links jump about on a page and users must re-orientate on the page to pick up where they were.
Google has a simple traffic light system; green is good, amber needs improvement, and red is slow. When compared to other sites, Google may prefer faster pages in results (which should provide a good experience) rather than a slow one.
Summary
Search Console allows you to monitor both the technical health and organic search appearance of your site. With regular expressions in the filters, it is now easier to isolate meaningful blocks of the site and assess content popularity, engagement and visibility. This flexibility, in turn, gives you a more robust basis on which to test things and see what makes a real difference.
The technical section still requires some sleuthing by marketers, but I believe it will see further development to allow site owners to drill into problematic pages. Currently, there is enough data to deduce common issues with the crawler, allowing meaningful changes to improve crawling, indexing and visibility.
As Google focuses on mobile accessibility and structured data, I'm sure the interface will morph and evolve to help in those areas. Currently, it highlights issues encountered but is still vague about identifying specific URLs with performance or accessibility problems.
While stakeholders can set email alerts, I'd expect canny marketers to be using the interface regularly.
It doesn't allow you to annotate (like Google Analytics), so any performance data following a site change or marketing drive needs to be monitored after the fact and stored/recorded elsewhere before the rolling 'data window' moves on.
Marketers need to avoid drawing unsupported conclusions and consider the sampling factor and lag between real-time information. The 'export' function allows you to pull data out through the Console or the Data Studio API and overlay it with other site data for additional insights.
Related reading
Do you have a challenge we can help with?
Let's have a chat about it! Call us on 01903 337 580