
The Trials and Tribulations of Data Analysis with GA4

By Julian Erbsloeh|28 Oct 2021
Analytics and Data | 24 MIN READ
I have to be honest; I have struggled with adopting the new Google Analytics 4 (GA4) since it first appeared in October 2020. If I quickly need to answer a data question, I will still jump into the old GA instead of using the new version. The new, event-based data model makes perfect sense. The implementation is more straightforward and logical, and the user interface (UI) provides much greater control over certain configuration aspects. But it's just not that easy to use. I have struggled to extract the level of insight that I can access easily from the current version of Universal Analytics (UA). So, I needed to know if it was just me struggling with this new version or whether the new platform is not yet there to take over the measurement baton from UA.
The new, event-based data model makes perfect sense. The implementation is more straightforward and logical, and the user interface (UI) provides much greater control over certain configuration aspects. But it's just not that easy to use.
Julian Erbsloeh, Strategy Director


Now, they say you can't train an old dog new tricks. But can you?
I have been using the Google Analytics (GA) interface ever since the early days of Urchin. I have spent the best part of the last ten years configuring, troubleshooting, deep diving, segmenting, pivoting, exporting and visualising GA data. I am also on the better side of 40 now, which makes me an old dog in the game, so naturally, I will resist change. Being aware of all the biases, I have put some concerted effort into establishing whether it was the tool's fault or mine. Still, I have always come to the same conclusion: GA4 is not very intuitive to use and lacks some basic but essential functionality.
Trying to extract meaningful insight has (on occasions) left me tearing my hair out and walking away from my desk to take a few deep breaths before diving back in. But was this the tool's fault, or was I battling maturity induced resistance to change?
So, to collect some more data to support my hypothesis (as you do), I asked members of our SEO CRO and Content teams to list out 4-5 tasks they frequently undertake in Google Analytics. With the tasks in hand, I would see if I could easily answer the same questions using only GA4.
I should have probably asked the guys to look for themselves and filmed them for a bit of fun, but that's for another post. You will find a complete account of how I got on with each of those tasks in this blog, hoping it will help you solve similar problems. I have also compiled this GA4 FAQ in the process to answer some of the recurring questions.
How to start looking for answers in Google Analytics 4 (GA4) user interface (UI)
In GA4, there are generally two ways of looking at your data
- Via a limited number of pre-built reports within the 'Reports' section
- By building custom reports within the new 'Explore' section. For this comparison
I first tried to complete each task by looking for the data in the Reports section before building a custom report in the Explore section if required.
One of the stellar features of GA4 is the free connector to BigQuery (BQ), which provides excellent flexibility and power to the analyst. However, for this little experiment, I will work from the perspective of a user who currently uses the GA UI, does not know SQL and has never used BigQuery, so using this new connector is not an option. We will explore the GA4 BQ data set and all the advantages that come with it in another post soon.
So, let's roll up our sleeves and, without further ado, get stuck into the data. Jump to a section:
Tasks the SEO team frequently use Google Analytics for
1. Compare traffic before/after a specific date (post-change)
Having the ability to compare metrics and dimensions across two different time periods is critical to understanding the impact of a change event on your website's performance. This change could be a design refresh, campaign activity, the market or an algorithm update.
A use case for the SEO team would be the implementation of some mark-up across a large number of blog pages. A couple of weeks later, we want to know the impact of that change on organic traffic and the number of page views and landings on the recipe pages.
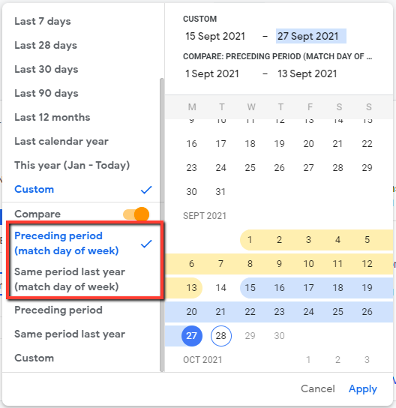
The first thing you will notice is that the date selector in GA4 has improved compared to UA, offering a better set of preset options, including matching the day of the week for comparison periods. This feature is critical for many (if not most) businesses to ensure they are comparing like for like.
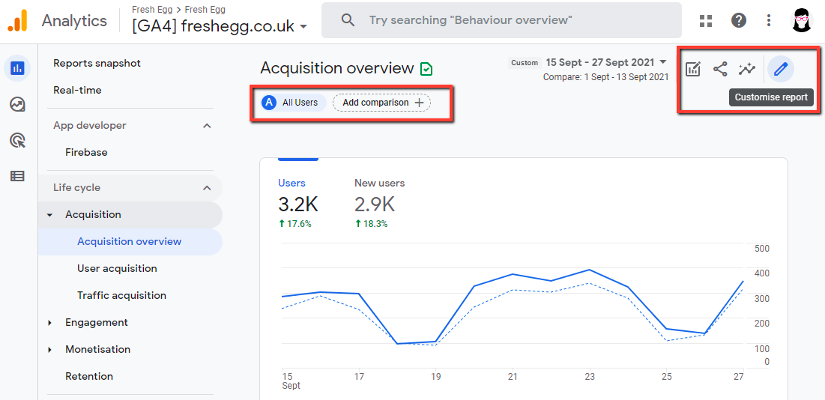
To learn if there has been an impact on Organic Search traffic, we head over to the Reports > Life cycle > Acquisition > Acquisition overview. This report provides top-level insights with the appropriately selected date range.
The screen shows six customisable reporting widgets that provide quick answers to top-level traffic acquisition questions, including a change indicator for the time periods in question.
The Acquisition reports seem pretty limited at first, but some key features here make them quite powerful.
- The overview is customisable – select the content of each of the panels to ensure this report answers your most important questions and monitors your most important channels and campaigns.
- Segmentation is now 'Comparison' - Users can create segments to compare, for example, device category or country with a few simple clicks.
- Automated insights created by GA4's machine learning capabilities – let GA do the hard work and tell you what has changed or where to focus your attention. These insights can be a bit hit and miss, but they will improve over time.
💡Pro tip
Create custom insights using anomaly detection for key changes.
To look into a detailed comparison across engagement and conversion metrics before and after our SEO change, you should next head over to the 'Traffic acquisition' report. Here you will find some familiar metrics, such as 'Users' and 'Sessions'. But if you are looking for 'Bounce Rate', you will be looking in vain as the metric 'Bounce' is no longer part of the GA4 data model. Instead, you will find a set of new, more meaningful metrics, such as 'Engaged sessions', 'Avg engagement time' and 'Engagement rate'.
Note that you can select specific events and conversions from a little drop down in the respective column.
In the Engagement reports, you won't find a trendline that summarises overall pageviews to a particular page or group of pages over time. You'll find more detail on this later in this article.
Could we achieve this task in GA4?
Yes, mostly and with some shiny new engagement metrics! In Google's extensive documentation, you can find detailed explanations for all of GA4's new metrics and dimensions.
2. Content grouping to understand the performance of templates, page types and site sections
This instance created a separate question from our SEO team, but it is still related to the above use case. We now want to understand how the mark-up has impacted individual blog pages and the entire blog category.
Head over to Reports > Life cycle > Engagement > Engagement overview.
At first glance, this report page may not feel particularly useful or intuitive. The first thing you will probably notice is that GA4 uses page names instead of the URL dimension 'Page' you are used to in Universal Analytics. Designed with web and app in mind, GA4 reflects that apps do not use URLs but screen names.
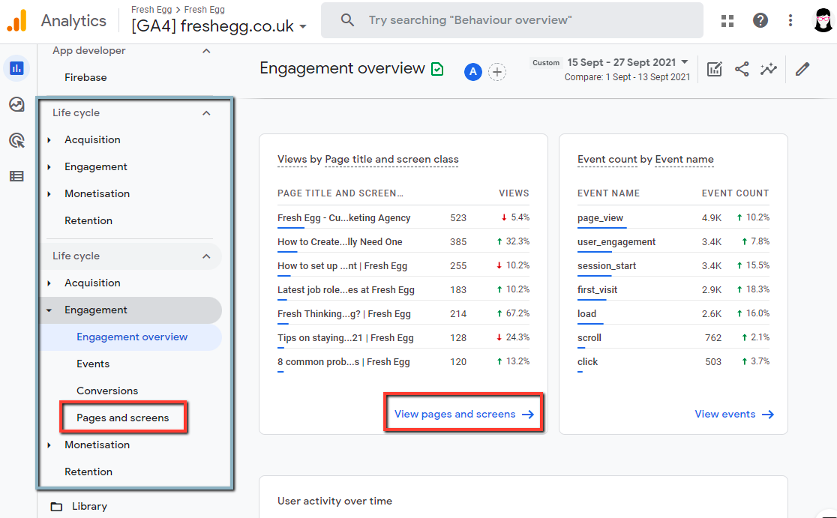
Head over to the Pages and screens report seeing if we can answer our questions.
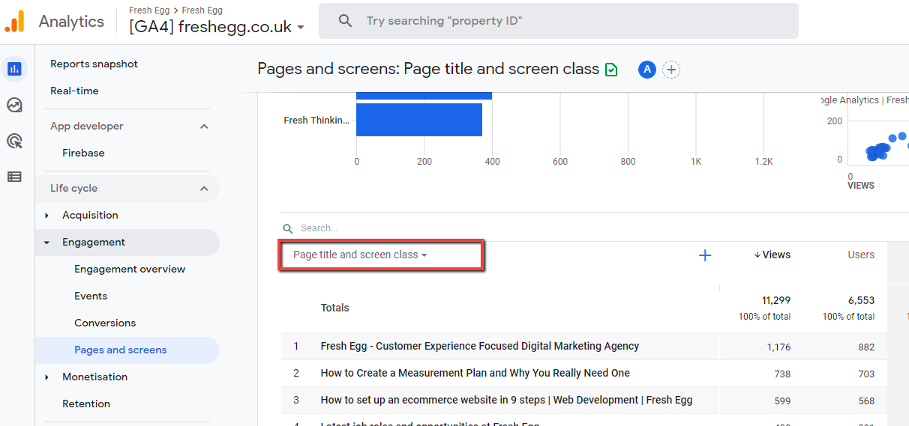
We want to understand the impact of a change to the metadata of all blog pages. To get the information, we use the Pages and Screens report in GA4. The default dimension we see is page title again, which may not be the most useful at this stage.
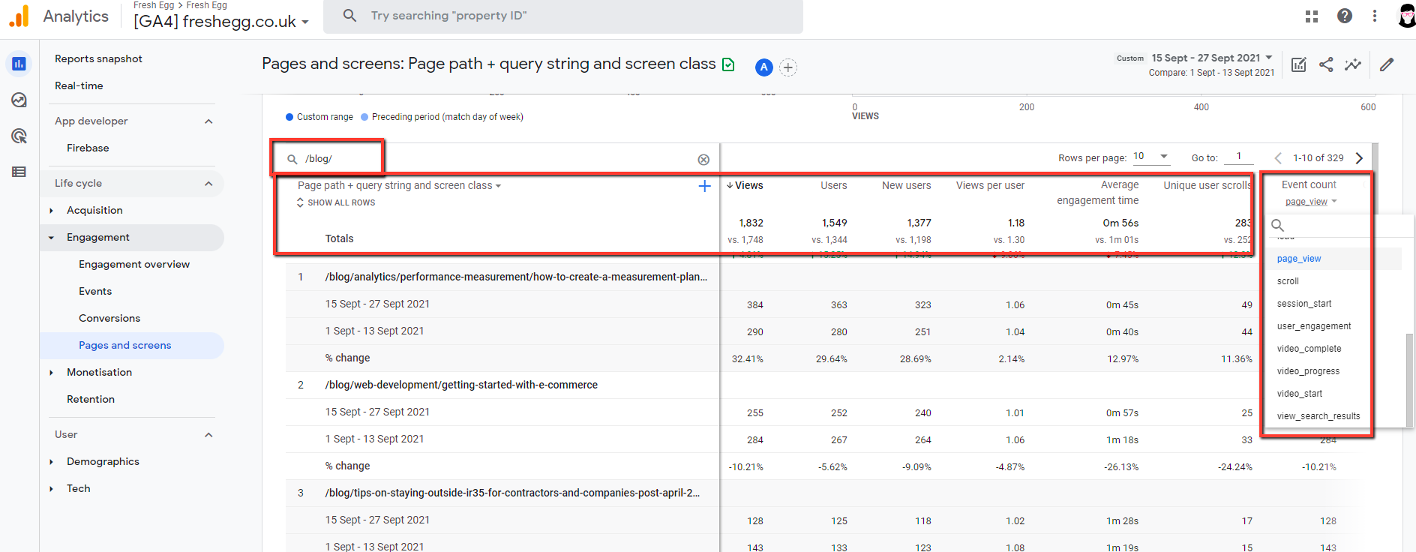
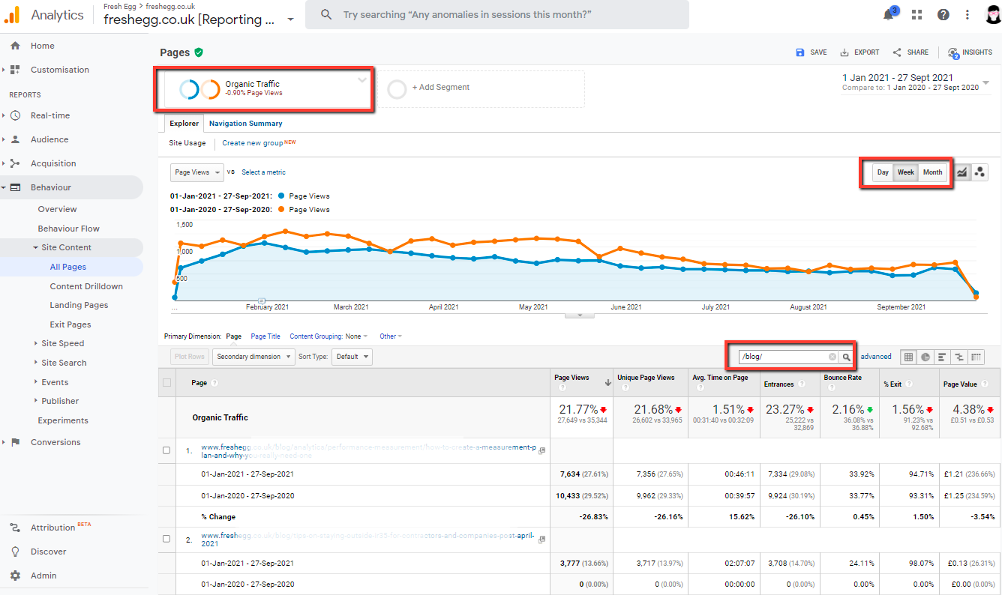
Locate the little drop-down at the top of the table and change the primary dimension to 'Page path + query string and screen class'.
But back to our task. We want to understand the impact of a change to the metadata of all blog pages. To get the information, we use the Pages and Screens report in GA4. The default dimension we see is page title again, which may not be the most useful at this stage.
Locate the little drop-down at the top of the table and change the primary dimension to 'Page path + query string and screen class'.
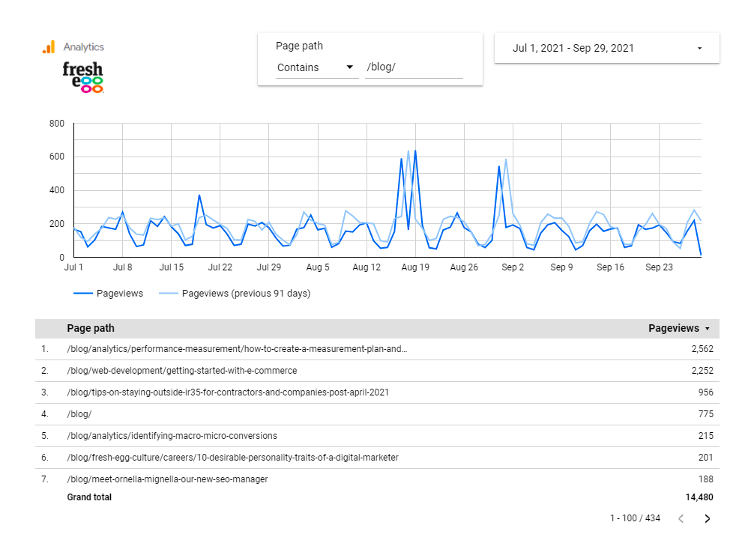
Next, you use the Search box to (only) include pages containing the subfolder /blog/ to get an overview of the performance of that section. 'Views' are the same as pageviews for web data. If your GA4 property contains web and app data, this combines the two. Head over to the Event count column, where you can drill down on specific events.
Warning: the line chart above the table does not adhere to your filter! So you won't be able to see how traffic to the /blog/ section changed over time. Currently, this is a real disappointment. A way around this would be to export this data and plot the graph yourself.
So, this default report allows you to look at how engagement with the site's blog section has changed since updating the meta tags. 'Now, what about content grouping?' I hear you say. You probably spotted the option already in the drop-down at the top of the table.
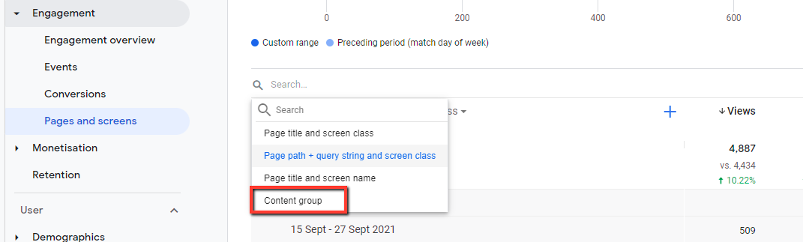
If you clicked it, you would have been disappointed to find that the only value available was the dreaded (not set) unless you have already set these up for GA4. Setting up content grouping is reasonably straightforward if you know your way around Google Tag Manager. I will publish a practical step-by-step guide for this soon. For now, you can follow the instructions in this blog post unless you already have a value for a content group in your dataLayer. If you do, push that into GA4 via the config tag.
Could we achieve this task in GA4?
Not without setting up additional tracking via Google Tag Manager. In Universal Analytics, we configure content grouping in the UI and we believe this feature is due to be released for the GA4 interface as well. A good workaround for this would be to group content in Google Data Studio using a CASE WHEN formula.
3. Monitoring the impact of page speed on website performance
Tl;dr – there are no page speed reports in GA4, but it can do something better.
Universal Analytics' set of Site Speed reports have been tremendously helpful over the years, as they allowed users of GA to quickly connect the dots between underperforming pages and page load times. By default, GA would collect page load time samples of 1% of all pages. The number could be increased to anything up to 100% via the GA config tag in GTM if a specific website area required some attention, for example. The Speed Suggestions report linked directly into the Google PageSpeed Insights tool, where page load scores were available for desktop and mobile, alongside detailed recommendations on improving load times.
Page load times became an important ranking factor for Google, which captured the SEO community's attention. Developers have long argued that an average page load time is not a helpful metric to understand how to optimise web pages for speed and performance. They preferred breaking page speed down into three major categories, known today as Core Web Vitals.
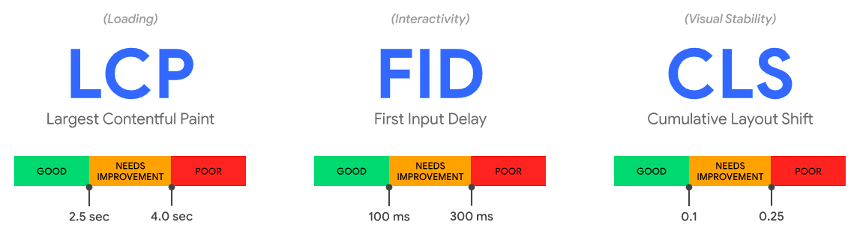
Core Web Vitals can be measured effectively using tools such as the open-source Google Lighthouse, which feeds data to Google Search Console, amongst other tools. If this is the first time you hear of Core Web Vitals, it is worth doing some more reading on the subject. I recommend reading this article here.
Monitoring Core Web Vitals in GA4 allows you to tie those important site performance metrics directly to your organisation's goals, namely the goals and events (and revenue) you track via Google Analytics. GA4 is the perfect web analytics platform due to its more generous data limits, the event-based data model, which provides more freedom around event parameters, and the data stream to Big Query.
Follow this blog post by GTM legend Simo Ahava to collect Core Web Vitals data in your Google Analytics. We strongly recommend you use GA4 for this.
Once you have combined those two data sets in GA, you can analyse and visualise the data from a single data source via Google Data Studio. We are working on a template to share with you soon, so watch this space!
Could we achieve this in GA4?
The everyday tasks our SEO team use Google Analytics for can mostly be done from GA4, even from within the standard reports available in the user interface. There are some powerful customisation features too, and while the reports may not be super intuitive, they appear to be up to the job.


Read our GA4 Frequently Asked Questions
Our team has put together answers to some of the most common questions about Google Analytics 4. From bounce rate to content grouping, our information will help you know Google's new reporting platform a little bit better.
Tasks the CRO team frequently use Google Analytics for
1. Comparing A/B test variants across key performance metrics
Our CRO team spend a significant part of their time analysing the impact of small changes they make to websites, using split testing tools such as Google's Optimize, VWO or Monetate. While all of those platforms provide their own set of performance data to show how each variant performed against the control, they often focus on one specific outcome to define whether or not the test was a success.
However, changing the dial on one metric (total number of transactions) might unintentionally impact other metrics (average order value). So quite often, the only way to ensure that a test did not have an unexpected effect on any of the secondary metrics is to dive into Google Analytics.
It now depends on how the A/B testing tool you are using integrates with Google Analytics and whether or not it offers a native GA4 integration.
At the time of writing, there was no native integration between GA4 and Google Optimize, Optimizely or Monetate but other tools already offer it, such as VWO, AB Tasty, or Convert. Most of these platforms use GA's custom dimensions for the integration. This feature makes it easy to create segments for each variant and compare them to one another.
Custom dimensions are also a core component of the GA4 data model, so it won't be difficult for all platforms to offer GA4 integration soon. However, the three major platforms we work on are not offering such integration at this stage, meaning our CRO team won't be able to leave Universal Analytics behind just yet.
Could we achieve this task in GA4?
In theory, yes, but we have not tested it. The data is available, but that does not automatically equate to accessing information in an intuitive and meaningful way via the GA4 interface is possible. Looking at some of the difficulties we had accessing basic engagement data in this post, this type of analysis is not likely to be easy.
2. Comparing the performance of grouped pages (for leakage calculations)
We have already looked at ways to group content in GA4; we achieve this by using the search filter to show only a particular group of pages, exporting data to excel (hit the share button), or setting up content grouping via Google Tag Manager.
However, there is no alternative to Universal Analytics' Content Drilldown reports or its dimensions of page path level 1-5. These dimensions allowed for simple but effective content grouping even if there was no implementation of grouping previously. This restriction means we cannot create a custom report within the Explore section to resolve this situation unless we first set up custom dimensions for each page path level in Google Tag Manager (a hack we will avoid for now).
The second part of that task mentioned leakage. Things become even more complicated when calculating leakage (as we have often discussed on our blog). Our CRO team calculate what we call 'leakage' to identify high-value pages of the user journey, where users are unexpectedly leaving the site. We prioritise these high-value pages for A/B testing.
Leakage = unique page exits x avg page value.
Currently, the metric page value does not exist in GA4, and no functionality allows us to set goal values. So, for now, leakage calculations are only possible in Universal Analytics, and our CRO team won't be happy about migrating to GA4 until the feature is available. What excites me is that GA4's event-based data model should allow for a 'page value type' to be associated with all events, not just pageviews.
Could we achieve this task in GA4?
This task was not possible in GA4 at the time of writing. However, the CRO team will most definitely love the new pathing and funnel exploration features of GA4 to complement the work they typically use in Google Analytics.
3. Identifying drop-outs in the conversion funnel
Finally! A task where GA4 has an opportunity to shine. There are two types of funnels that we can create in Universal Analytics, the Goal Funnel report and the Checkout Behaviour report in Enhanced Ecommerce enabled UA properties. Both of these reports are useful, but neither solution is perfect.
The Goal Funnel reports are linear and only consider pages and not events making them hard to use on single page checkouts. They also don't deal too well with users skipping steps, as the funnel will automatically back-fill, rendering your data useless.
The Checkout Behaviour report is more powerful. It allows us to create segments of audiences dropping out at each stage quickly. It can provide a lot of detail on each step – but it isn't straightforward to set up, so most UA configurations we audit are not using this report effectively.
So, the best way to get a meaningful funnel report with UA data has been to build one yourself in Google Data Studio.
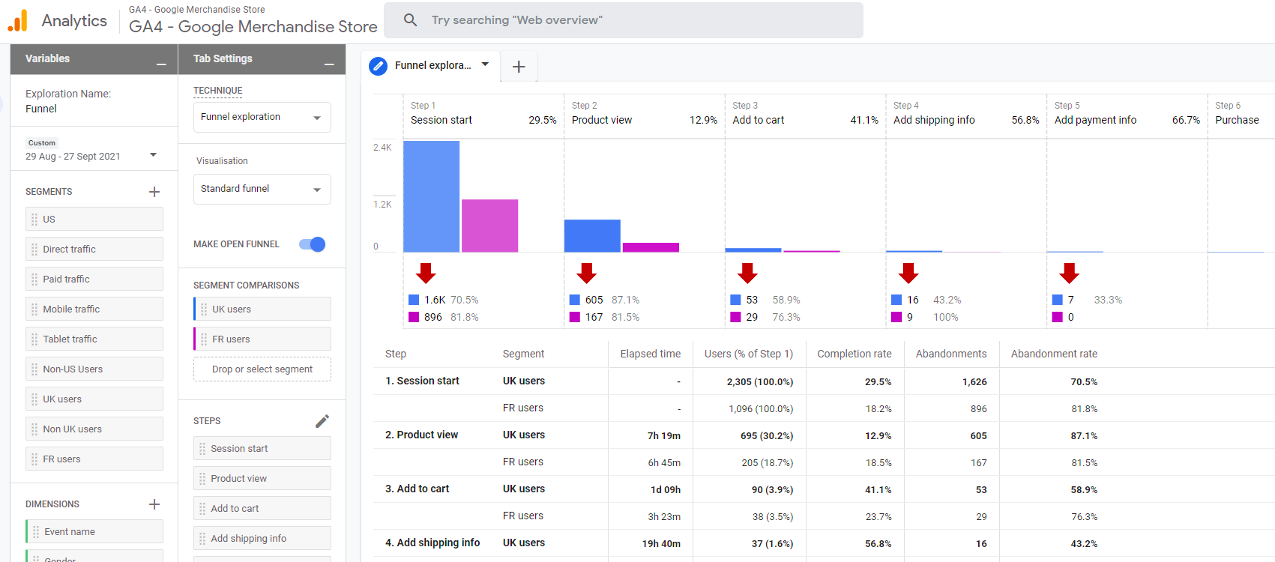
GA4 allows you to create custom funnels of pretty much any journey through the website with a Funnel Exploration report, which you can find in the Explore section. This feature contains some compelling functionality better than anything we have seen in Universal Analytics, but you will learn how to use it first.
Some of the features I was most excited about were:
- Total flexibility to build any funnel I wanted (as long as the interactions are tracked)
- Easy segment comparison is supported visually by hovering your mouse over the chart; there is also a segment overlap exploration now, which is awesome!
- Breakdown dimension – want to compare funnels across device categories in the UK vs Non-UK? Easy 😊
- The ability to set time limits - for the funnel step conditions, meaning users remain in the funnel if they complete each of these steps within a certain amount of time.
- 'Show elapsed time' - introduces a column that shows exactly how long the user took for each stage; this helps identify steps that took longer than expected.
- You can change the bar chart funnel view - for a trended funnel which allows you to quickly recognise funnel behaviour changes over time (which is impossible in a bar chart!)
- A toggle to select between 'open funnel' and 'closed funnel' - A closed funnel only includes users who start at the first step, while an 'open funnel' has users who begin the journey at any point.
The list goes on. There are so many cool features that this should be your first port of call for any type of funnel analysis. Taking you through how to use this reporting feature effectively is outside the scope of this post; if you are keen to learn more, head over to our friend Julius at Analyticsmania.com, who has written a great guide on this topic.
Could we achieve this task in GA4?
In summary, the CRO team would struggle to do what they need to do in GA4 today, but they will love some fantastic new features. This outcome makes a strong case to start running the two in parallel.
Let's take a look at how our Content team uses Google Analytics next.
Tasks the Content team frequently use Google Analytics for
1. Monitoring performance of top organic landing pages
We have been through the individual elements of this task, such as looking at page performance, grouping pages, and looking at landing pages and channels, but we still have to put them all together. The term 'monitor' also suggests a requirement for understanding trends over time in a timeline and frequent re-visiting of the report(s), so they should be easy to access.
In Universal Analytics, we would go straight to the Landing Pages report and apply a segment for Organic Traffic, plus a filter for the site section and job. We would then save this report for quick access next time around. In UA, we can play with the date range and easily adjust the time dimension to week or month to better understand the trend. This report's most prominent and helpful element is the trendline, which provides a summary trend for all pages selected below.
In GA4, we start in the Pages and Screens report (Life cycle > Engagement > Pages and Screens), where the first thing we do is create a segment for Organic Search traffic instead of the default All Users segment.
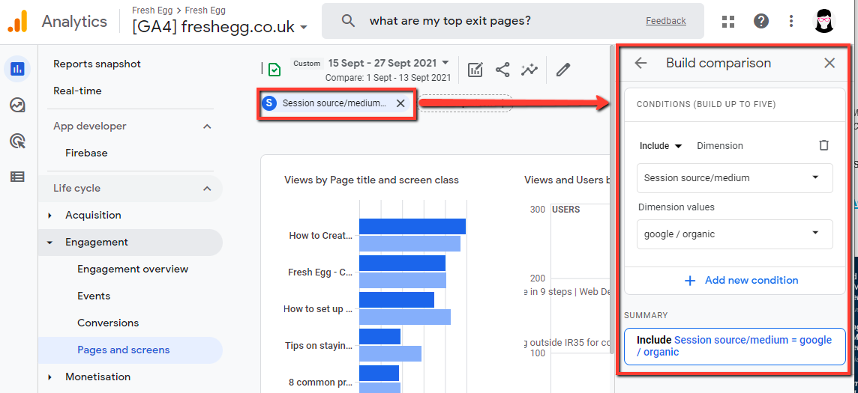
But this is (sadly) where the similarities end! The default report does not provide us with a familiar timeline. Like many areas of GA4, this screen is customisable by clicking the 'Customise report' option in the top right corner. While this allows us to swap the bar chart and scatter graph for a line chart, it provides a single line for each of the top five pages in the table below. For me, it is a deal-breaker and makes this report pretty much useless for this task.
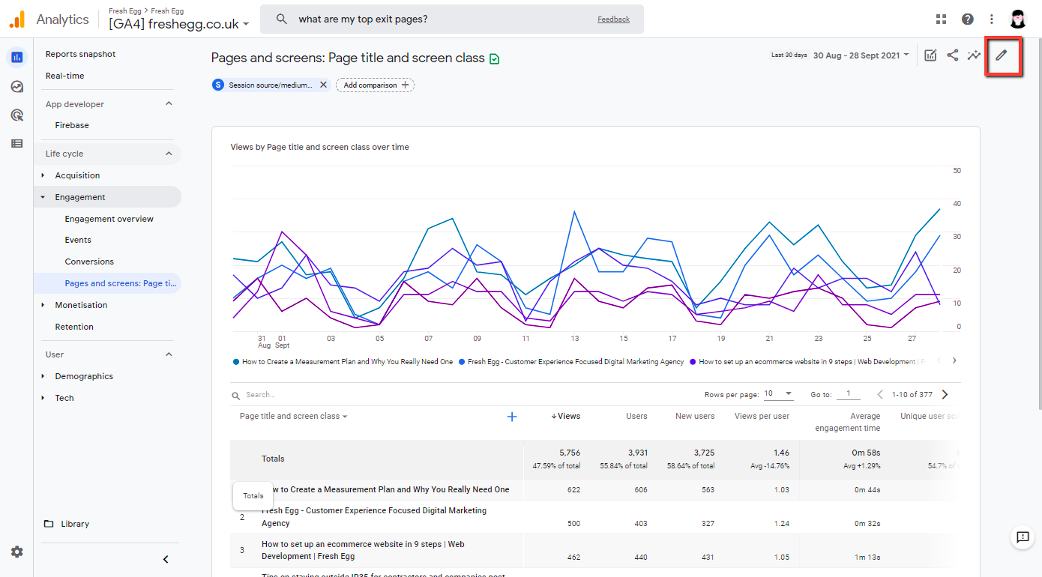
And that is not the only issue with it, here are a few more things we found:
- Using the search function to only look at /blog/ URLs filters the table below, but the graph above remains unchanged, meaning that unless the page you are looking for is one of the top five most visited pages, you won't get a timeline for it.
- Clicking on a URL does not focus on that URL and show the corresponding graph above. It does not do anything.
- The search filter does not (yet) support regular expressions (regex), which dramatically limits the ability to filter the table and drill into the data.
- There is no ability to change the date dimension from days to weeks or months; this makes it difficult to understand trends over longer timelines.
- A positive: Clicking each metric column in the table (Users, Views, Event Count) will show that metric in the chart above. This feature is not intuitive, but it works.
So, it's fair to say that this standard report is not up to this basic task.
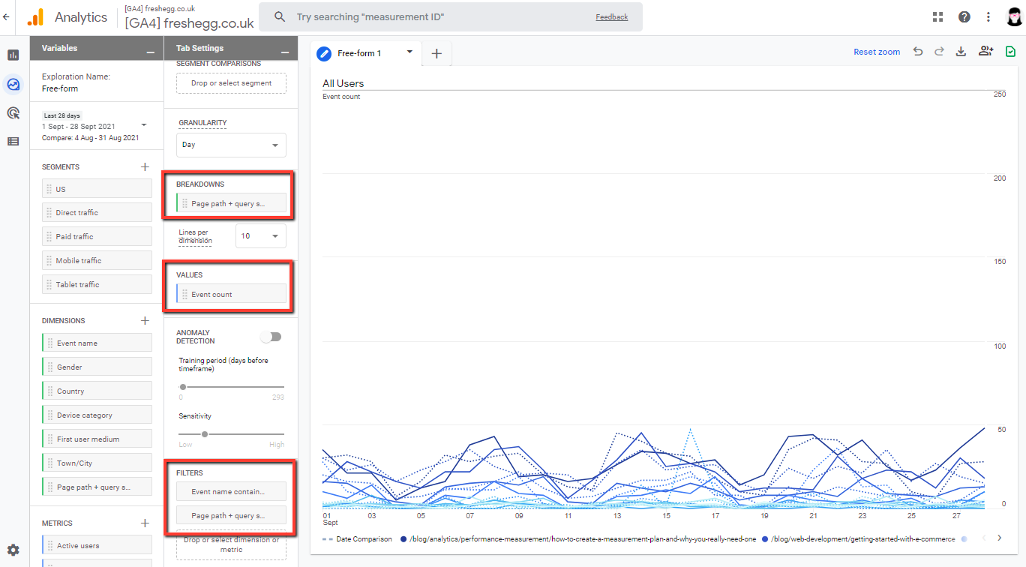
Creating something useable in the Explore section of GA4 starts with creating a new Free-form report template. Adding the dimension 'page path +query string' and the metric 'Event count' requires filters for 'event name matches pageview' and 'page path contains /blog/' to get to the data we are after.
The result is pretty shocking – a spaghetti line chart that shows a single line per URL instead of showing us a single line for totals. You can only choose between a line graph and a table, the option of having one above the other is not available.
Could we achieve this task in GA4?
Not within the GA4 interface. At this time, the only way to complete our task using GA4 data appears to be via Google Data Studio, where we can whip up a rapid report that allows us to dive into this data as we used to.
Unless you are handy with Google Data Studio (or BigQuery, but we said we would not mention that), GA4 can make it difficult for you to surface and visualise some of this data in the way you are currently doing in Universal Analytics.
2. Learning how users find content (navigation, site search, landing pages, GSC)
The guys and gals from our Content team frequently try to determine how users navigate to a piece of content to understand if that content is visible enough (in search engines or the internal navigation or site search).
Finding out about traffic sources to your content is straightforward in GA4, so let us focus on the user flow or navigation part of this question. Analysing and visualising user flows in a meaningful way has been Google Analytics' biggest criticism over the years.
Our team uses the Navigation Summary visualisation option within the All Pages report to better understand navigation within a website. This summary gives them the 'Previous Page Path' and 'Next Page Path' dimensions. These dimensions are also available via the API/Data Studio connector to build some valuable reports. But they never told the whole story.
"I would use the User Flow report more frequently, but it's useless" is a statement I have heard many times. You probably share that sentiment if you have tried making sense of those flow reports in Universal Analytics.
Enter GA4 and its brand new Path Exploration report, which you can find as a template in the Explore section of the site. This report offers a host of new functionality that significantly improves what UA could offer us, similar to the Funnel exploration.
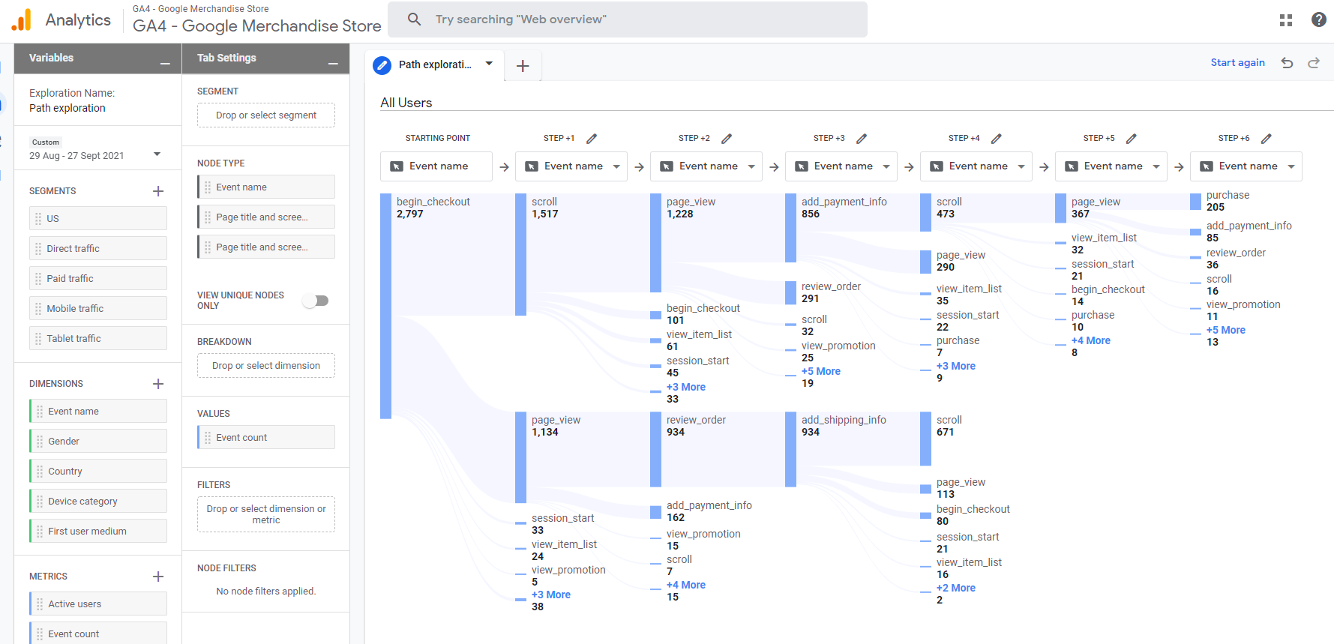
Some of the functionality I have been most excited about in this report are:
- Create user flows from any starting point, whether that is a page or an interaction
- Reverse pathing analysis – you can start with the endpoint and work backwards
- Explore the flow by clicking on the node that you are interested in, to follow users onwards from that step and hit 'start again' when you have followed one too many rabbit holes
- Easily compare across device types using the 'Breakdown' dimension
Could we achieve this task in GA4?
Yes!😊 This feature is new and different to anything you have previously used in Google Analytics. It is not particularly intuitive, but once you have mastered it, I am confident that you will love it! Head over to this Google Help Centre article to learn how to make most of this tremendous new report.
3. Understanding what users do with content?
GA4's new engagement metrics are much more meaningful than what was previously available in UA and provide a great starting point to answering this question.
The definition for an 'engaged' session is:
10 + seconds on site, 2+ page or screen views or 1+ conversion interactions.
This measurement is a lot more meaningful than the now-defunct bounce rate, which did not distinguish between a user spending 1 second or 5 minutes on a page.
The Pages and Screens report also provides an average engagement time, scroll activity, event count (with the ability to filter the events included in this count quickly) and a conversion count. This view is only possible due to the new and improved data model of GA4. Previously, conversions were a session-scope metric (so only session-level dimensions such as channel or landing page could be reported in the same table as conversions). They are now available as a hit level metric. Whether this is better than UA depends on your individual use case, but it's distinctly different from UA.
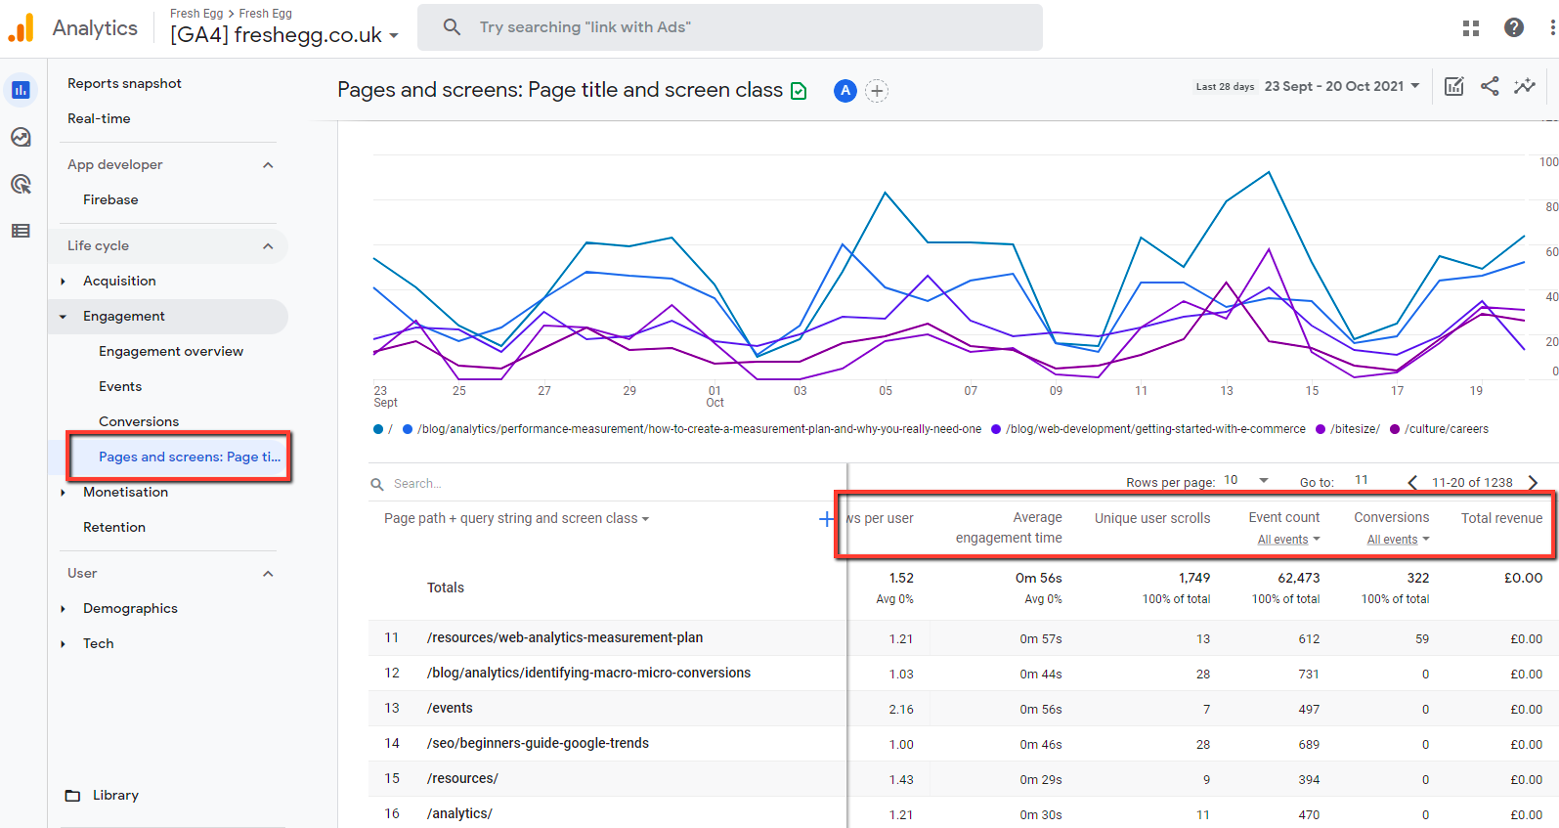
What is clear is these metrics don't show how content contributes to conversions happening on other pages.
In Universal Analytics, we had the powerful and often underrated metric 'page value', which would allow us to segment for pieces of content that were frequently part of a converting user journey, also referred to as a contribution metric. With what we currently have available in GA4, this isn't possible to answer without exporting the entire data set to BigQuery and doing some modelling.
The last column in this report is a Total Revenue metric which is misleading and seems utterly useless for most businesses. Total revenue cannot be assigned to any other page than the order confirmation page unless your site takes money on product pages! There might be a few cases that could be useful for charities collecting donations in different site areas, but those will be rare.
Could we achieve this task in GA4?
Broadly speaking - yes. Except for page values, we get a pretty good grasp of what users do with our content. We have a better view of events and conversions happening on those pages, and if we want to better understand the impact on conversions further down the funnel, we can use the Explore section to build a few funnels.
Some basic tasks the Analytics team frequently do in Google Analytics
1. Investigate unexpected traffic spikes and exclude spam/bot traffic
These two tasks often go hand in hand. Most of you will have seen an unexplained spike in traffic to your site at some point, only to find out that it was bot traffic. Bot traffic (also referred to as 'non-human traffic') is an age-old problem. A few years ago, I wrote a blog post on identifying and removing bot traffic; the problem has not gone away.
Not all bot traffic is bad. The world wide web is teeming with bots that automate repetitive, large scale tasks for many businesses. Google's bots crawl over every website to learn what the site is about and show the most relevant search result in Google Search. Uptime monitoring tools will frequently visit your sites to ensure they are up and running as expected and alert you if anything has broken. Price comparison websites will crawl retail websites and scrape prices to provide users access to the best offer - the list of use cases is long. All of these elements have the potential to skew the data seriously.
GA4, like UA, automatically excludes traffic from known bots, using the list published by the Interactive Advertising Bureau – this should give you peace of mind that your data is clean… but we know that it does not capture all bots, far from it. .
Identifying bot traffic has become more complex with the deprecation of the dimension 'Service Provider' a few years back. There are solutions to capture the user's Internet Service Provider (ISP) and to push that data into a custom dimension in UA, then exclude it based on that dimension. However, this is not an option in GA4 due to the minimal filter functionality at the point of data collection.
Could we achieve this task in GA4?
While it is possible to identify and exclude non-human traffic based on behaviour patterns following exporting data to BigQuery, it will be impossible for most users to manage bot traffic exclusion in GA4 actively. This flaw dramatically impacts data quality, so I am sure this is a deal-breaker for many when it comes to migrating all tracking to GA4.
2. Channel performance reporting
'Omnichannel' has been a digital marketing buzzword of the past decade and, during that time, digital folks have been working hard to design, measure and optimise positive brand experiences that span across channels and devices. While the exact definition of some channels might vary slightly, we digital professionals (broadly speaking) agree that grouping sources of traffic, for example, device types, ad formats or delivery mechanisms, into channels is useful. Grouping in this fashion helps the marketer devise appropriate strategies by channel.
This feature was reflected in the navigation and functionality of Universal Analytics but is yet to appear in GA4. To access a version of the Channel Performance report in GA4, head over to Reports > Acquisition > Traffic Acquisition and change the primary dimension drop-down from 'Session source/medium' to 'Session by default channel grouping'.
You cannot double click into each channel to drill deeper, nor can you amend the default channels. Still, you can read how the grouping automatically happens for you in Google's official documentation.
Editing the default channels to create new ones or sort traffic that the automated grouping has missed into the corresponding channel is no longer possible. Creating custom channel groupings that apply to historic data is no longer possible either.
Ultimately, channel groupings are just simple rules applied to the Source/Medium dimension, which is possible in BigQuery with little effort. But for most regular users of Google Analytics, that is not an option as they may not have the required SQL skills or the expertise to set up the BigQuery environment and make the appropriate tables available in Google Sheets or Data Studio. Custom channel grouping was never available in the API. We created channel groupings using the CASE WHEN formula to work with anything but the default channels in Google Data Studio. This blog post explains how to do that.
Could we achieve this task in GA4?
While basic channel reporting is possible, this is nowhere near as valuable and meaningful as the channel analysis functionality provided by Universal Analytics. To get real value out of this, you would be best off building custom reports or by using Google Data Studio.
3. Troubleshooting tracking configurations
As Analysts, we spend a considerable amount of our time debugging GA implementations. Debugging could include verifying data integrity or helping us interrogate user behaviour on the site.
Stepping through (and recording) a user journey is the quickest way to know what tags are firing and the type of data being collected.
Google Tag Manager's preview mode allows us to monitor which tags are firing and what data each of them is capturing. The GA4 interface introduced a new DebugView, which, combined with the GTM Preview, shows a real-time view of all the hits collected during our session.
Could we achieve this task in GA4?
This new GA4 feature can still be a bit temperamental at times. It will undoubtedly form an essential part of our workflows in the future. For a detailed explanation on how to configure and use the DebugView, please see this blog post.
My conclusion
In summary, I think it is evident from the above use cases that GA4 packs some exciting new features and shows great potential. That said, it is not ready to fully support your marketing teams and your business with performance and/or user behaviour data to the level that Universal Analytics does, especially if you are not familiar with advanced analysis in Google Big Query.
However, GA4 is here to stay, so if Google Analytics plays an integral part in your digital marketing strategy, you and your team must get started and familiarise yourselves with the new data model and Google Big Query. Google's recommendation is to start running GA4 in parallel to your existing Universal Analytics implementation, so you and your team can learn on the job while benefitting from the new features of GA4, and we agree.
One more upcoming change to consider is the complete extinction of 3rd party cookies and how that will impact your ability to remarket and build audiences in your Ad platforms etc. GA data is first-party data, and its ability to create behavioural audiences and push those into our bidding platforms will become more critical than ever. I recommend making a move now to stay ahead of your competition. With every threat, there is an opportunity for early adopters to gain an advantage.
We will continue to produce and share valuable GA4 content to help you with this transition and are, of course, always available for a chat, so keep an eye on our blog and subscribe to our newsletter. Our services include various levels of training on the tools of the Google stack and fully managed migrations to GA4 for large scale accounts. As a Google Certified Partner, we have a full view of the product road map and early access to most new features, as well as access to the Google team, so your GA4 migration could not be in safer hands.
Disclaimer: All the answers to common questions and screenshots were accurate at the time of writing but may have changed by the time you read this. If you spot something that has changed, please do let us know. We will review and update our GA4 FAQ content regularly.